How Should Distributed Generation be Distributed?
Growth in the residential solar market continues apace. In the United States, residential solar PV installations last quarter were up 11 percent over the previous quarter:

Source: http://www.greentechmedia.com/research/ussmi
The figure illustrates this impressive growth rate (in dark blue). However, this is growth on a very small base. By my crude calculations, less than half a percent of American households currently have solar panels on their roof.[1]
In those states where residential solar is starting to take hold, there are mounting concerns that rate structures currently in place to support residential PV will result in adopters bearing less than their fair share of system costs. If increasing levels of distributed solar generation puts additional pressure on grid equipment and aging infrastructure, these concerns loom even larger.
A new EI working paper takes a close look at how increasing levels of distributed solar generation can impact power system costs. For me, this paper raises a timely question: should we be paying more attention to where distributed generation gets distributed?
Bill savings for the adopters
Before diving into the details, let’s first review the basic issues.
If you have invested in putting solar panels on your roof, chances are the solar electricity you generate is valued at retail rates one way or another. This is thanks to net metering policies adopted in most states. If you consume the electricity you generate, you avoid purchasing electricity from your utility. If you do not use all the electricity that your solar panel is generating (it is estimated that almost half of electricity generated by net metering customers in California is exported), you can export the extra power to the grid and count it against consumption within the same billing period.
As we’ve discussed before on this blog, the marginal retail price can significantly exceed the direct energy costs of producing a kilowatt-hour centrally. On the one hand, many of the costs that are reflected in retail prices (e.g. metering, billing, and infrastructure costs) are not avoided when you put solar panels on your roof. On the other hand, solar PV generates benefits that are not fully reflected in market prices.
So what is the right price for distributed solar generation? Past blog posts have touched on some elements of this value-of-solar calculation that fall squarely in the purview of economists. But there are other important elements that push outside the boundaries of economics. This week, we venture into the engineering-meets-economics world of distribution system costs.
I am no an engineer, but I am fortunately married to one, who is a co-author of the new EI working paper. Much to the chagrin of my kids (who’d rather be talking Frozen or fire trucks), I have been steering the family dinner table conversation towards this paper which looks at how distributed solar affects the electricity distribution system. The findings should be of interest to energy economists and engineers alike (but not so much three and five year olds it turns out).
The distribution system meets distributed generation
A quick summary of what I’ve learned at my dinner table.
If you install solar panels on your roof, this will impact how power flows through the distribution system that delivers power from high voltage transmission networks to the people in your neighborhood. The cartoon below helps to fix ideas.

Source: http://www.slideshare.net/bhagwanprasad50/transformer-basic
Some of these impacts can reduce costs. For example, less electricity flowing into your neighborhood during peak times can reduce pressure on aging infrastructure (e.g. distribution lines, service transformers) and defer the need to invest in distribution system upgrades. That’s good. But increased PV penetration can also increase the need for investment in hardware such as voltage regulation because distribution systems are not designed to handle power flowing from customers back to the substation. Not good.
The cartoon above shows a single “feeder” (a collection of distribution lines that carry power from the high voltage transmission system to customers). Using detailed data on all 3,000 feeders operated by the largest utility in California, PG&E, Duncan and coauthors simulate how increased solar PV penetration on each feeder would impact the need for system capacity upgrades, expenditures on voltage management, etc.
On average, they find that the levelized value of deferred investment in distribution system upgrades (avoided costs) is small: around half a cent per kWh. This is in line with rough estimates found in other reports that use highly aggregated data.
But the advantage of disaggregated data is that they can look beyond the average. It turns out that this economically insignificant average value obscures tremendous variation in feeder-specific capacity values. Capacity values are zero across a large majority of feeders where no capacity upgrades are anticipated over the next ten years. But for approximately ten percent of feeders, the picture looks quite different.
The figure below focuses on the 298 feeders where capacity upgrades are anticipated in the next ten years under a business-as-usual scenario. This represents about 20 percent of the total capacity, or approximately 1 million customers.
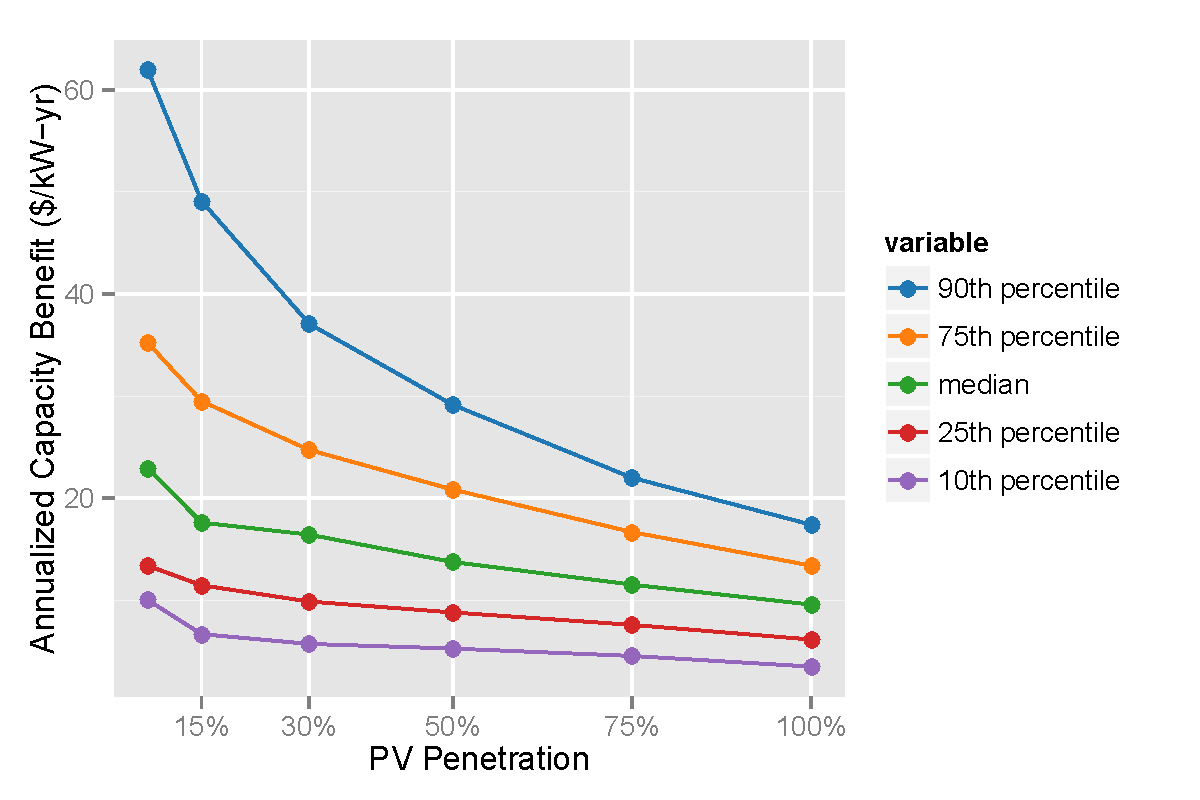
The figure shows that estimated capacity values exceed $60/kW-year (or $33/MWh using their discounting and electricity production assumptions) for approximately 30 feeders (this assumes a solar PV penetration rate of 7.5 percent). This is almost on par with the energy value. The median capacity value in this select group exceeds $20/kW-year ($11 per MWh).
Although there has been much hand wringing over the potential for voltage regulation problems, the authors find that these problems are actually relatively small. Using PG&E’s current budget for repairing voltage regulating equipment, they estimated that even in extremely aggressive scenarios for PV deployment, the total costs to ratepayers would be less than half a million dollars a year.
Distribution matters
On average, this study finds that the average (distribution system related) net benefits of distributed solar PV are not very significant. However, looking beyond the average, the value of deferred investments in distribution system infrastructure associated with a given level of distributed generation depends significantly on how these resources are distributed on the system. In other words, the net costs of future distributed generation could be significantly reduced if these resources are targeted to areas where they can generate the largest benefits.
There is precedent for targeting energy efficiency to defer investments in transmission and distribution system upgrades… why not solar PV? If the next generation of distributed solar incentive programs and resource planning protocols reflect the impacts that these resources could have on different parts of the distribution system, the next generation of distributed resources can be more efficiently distributed.
.
[1] To estimate the number of systems, I divide GTM research estimates of installed residential PV capacity in 2014 by the state-specific average residential system size (as reported in Tracking the Sun, 2014). I then divide this by the US Census estimate of the number of US households in 2014. Thanks to Naim Dargouth and Snuller Price for the solar PV numbers!
Categories

Reblogged this on Economics Outside the Cube and commented:
Bruce Mountain observes in the Comments that Australia already is experiencing deep solar penetration, but is not find extensive disruptions in the distribution networks.
If we want to coordinate all generation on the grid, treating distributed generation (DG) the same way as central station dispatchable power (CS), then we need some real time pricing for distributed generation. Since the distribution facilities value of DG varies by line, that says that we need to get away from postage stamp pricing for some parts of the use of the distribution facilities. So, real time pricing for the 30 or so feeders at the top of the graph, and for the other feeders as they get more heavily loaded.
The real time pricing (RTP) mechanism for the distribution grid must be severe enough that ordinary customers without DG can profitably change to the RTP to get a lower distribution charge. Occasionally it must hurt. Negative feedback provides a way to set such prices. Line losses and local voltages should play a role, as is suggested by Meredith. But as art2science points out, voltage sag on hot days gets extreme. As the voltage pushes the limit nominally acceptable to the engineers, the price should become extreme. That means very high prices when the voltage is low at the customer interface and very low prices when the voltage is high at the customer interface, as in the case of excessive DG.
I wrote about this years ago in both
“Microgrids And Financial Affairs – Creating A Value-Based Real-Time Price For Electricity,” Cogeneration and On-Site Power Production, September, 2007.
http://www.cospp.com/articles/article_display.cfm?ARTICLE_ID=307889&p=122
“Dynamic Pricing: Using Smart Meters to Solve Electric Vehicles Related Distribution Overloads,” Metering International, Issue 3, 2010.
Regarding the pricing of distributed generation, have a look at the approach recently adopted by the British regulator (https://www.ofgem.gov.uk/licences-codes-and-standards/codes/electricity-codes/distribution-connection-and-use-system-agreement)
Anyway, pricing distributed generation is inevitable.
Thanks for the post, I found it interesting. I write from Australia where around one in five eligible households now have solar panels on their roofs. Our typical residential electricity prices are around three times the North American average and with lots of sun and rapidly declining solar panel costs it is now much cheaper to produce electricity on household rooftops than it is to buy it from the grid.
The issues your raise in your paper have been well rehearsed in Australia. Local voltage issues are generally agreed to be a non-issue as you say. In some areas with very high levels of rooftop PV penetration have required automated tap-changers on distribution transformers. But modern inverters can be appropriately configured. Issues of feeder capacity are also typically non-issues. Feeders are typically designed to meet diversified demands that are much higher than capacity feed-back from rooftop PV even assuming very high levels of PV penetration.
A difficult question in Australia has been the impact of PV on the shared network (not the individual feeders). Power production on a household rooftop at the time of system peak demand effectively increases the spare capacity on the shared network in the same way that a reduction in demand). This is difficult to quantify. In Australia there is installed rooftop PV capacity of around 4,200 MW in a system with a simultaneous peak demand of around 30,000 MW.
An enduring issue in Australia is reduction in revenues to the network service providers from households with PV (which they can recover by increasing overall prices). The network service providers are seeking to deal with this through increasing the fixed charges in their tariffs. Needless to say this is very controversial and the economics of the issue can be seen from different perspectives.
There is now very avid interest in the potential for batteries to allow complete disconnection from the grid. The economics of this (to households) seems to be increasingly favourable. Several of our retailers have capitalised business divisions to grow revenues from consumers who they expect will buy less from the grid and are expected in time to completely disconnect from the grid.
These are of course profound changes. The engineering and technical issues for the existing grid do not seem particularly challenging. The really interesting (and challenging) issues are economic and strategic and there has so far been limited examination by economists in Australia or internationally, of the many fascinating issues.
How many of the circuits require upgrades because present day local loads exceed the as built capacity from decades earlier? Given some recent outages have been tied to poor overnight cooling conditions, would the daytime net generation not address that issue?
Duncan tells me PG&E does about 30 feeder projects a year, and most of that is coming from load growth exceeding the capacity of decades-old equipment. Some circuits certainly will have peaks late in the evening and there won’t be much capacity benefit.
Thanks for summarizing the good and bad effects of distributed solar power on distribution systems. But you left out the ugly. Engineers at the Hawaii Electric Company tell us that there’s a part in the substation transformer that can eventually blow up when electricity not only flows back to the substation but switches from positive to negative flows several times a day, due to changing cloud cover. The repair would be time consuming and costly (more than just replacing said part) and leave customers w/o power in the meantime. Is this just a scam to convince consumers to (over) pay for expensive upgrades?
—- In the dark
Thanks for the comment. A lot of the problems of variable reverse power flow show up as voltage swings, and substation transformers have to manage that. The paper did look at that issue and it is embedded in the voltage cost calculations. Hawaii may have more frequent partly cloudy conditions — so it’s easy to imagine the problems could worse there. Note also that Reverse flow can also cause problems for circuit breakers, and there is no good economic precedent for the cost to deal with those problems, so the paper had to remain silent there.
I did not see any discussion of distribution losses in the paper or your note. The LMP at the substation accounts for transmission losses, but there are some additional losses between substation and house. Generally the marginal distribution loss will be small – a few percent. But voltage sag at the house on hot days suggests that they are not always small, and if the distribution system is sized optimally, they should sometimes be large enough to matter. And these losses will tend to be most at exactly the locations which need substation upgrades.
Or, were marginal distribution losses already in the LMPs somewhere?
Thanks for the question. The distribution network model used by the authors estimates distribution losses directly, so all results — whether in terms of kW of PV or kWh of energy — include circuit losses when they are calculated.
I asked the question last year is “optimal location” the next “least-cost best-fit” with all of its accompanying ambiguity. (https://mcubedecon.wordpress.com/2014/10/03/will-optimal-location-become-the-next-least-cost-best-fit/) One the key answers is whether the underlying data is truly transparent (as it is not in the case of LCBF). This type of study is necessary to achieving the required transparency.
BTW, the link to the paper on geo targeting energy efficiency is dead.