The Distribution Grid Has Room for More Solar
There is evidence that bigger isn’t necessarily better when it comes to solar energy projects.
Economies of scale suggest large projects would be more cost-effective than small ones. But recently, Lawrence Berkeley National Lab (LBNL) did an analysis of solar projects that came on-line in 2014. Their study collected information about ground-mounted, utility-scale projects (though notably not rooftop solar).
The chart below from the report groups together projects based on their size. The height of the bars reflects the capacity-weighted installed price, denominated in dollars per watt.

The LBNL researcher found the smaller utility-scale projects had a LOWER cost per watt than the largest projects. (Note: the smaller projects in the report are still more than 1,000 times larger than the average residential rooftop system.)
Why would this be? The report’s authors hypothesize that the larger projects face regulatory and interconnection complexities that drive up costs. Smaller projects (around 25-50 acres) have an easier time clearing these hurdles.
The full cost of the biggest projects may even be higher than the graph shows. This is because the prices collected by LBNL do not include all of the infrastructure costs associated with the projects. Key among these is the cost of building out the transmission grid to reach them and increasing the overall capacity of the grid.
It can be hard to tie specific transmission system upgrades to particular power plants because the grid is so networked. The transmission grid is similar to our road networks. Building a large residential development on the outskirts of a city far from workplaces not only requires building roads to the specific development. The new residents will also cause more traffic on roads throughout the metropolitan area and require the freeway system to be expanded.
Similarly, the development of large-scale renewable energy projects in remote locations in California has spurred a significant expansion of the state’s transmission grid. In fact, transmission expenditures have grown more rapidly than any other major utility expense category.
For Southern California Edison (SCE), transmission costs grew at an average annual rate of 9.5% between 2005 and 2015. For customers this showed up in retail prices. For example, SCE’s large commercial and industrial customers experienced a tripling of transmission rates over this time period. The graph below, drawn from an annual review of utility costs, performed by the California Public Utilities Commission shows this trend in total transmission costs.

Meanwhile the smaller projects, in the 1 to 3 Megawatt range (just slightly smaller than those covered by the LBNL study), can be connected directly to the distribution grid. The distribution grid includes all the power lines, poles, transformers and other equipment that carries electricity from substations to homes and businesses.
It may be possible to tie these smaller projects into the grid without triggering large infrastructure investments. Using the housing analogy, if housing is built close to workplaces then a significant number of residents could have short commutes on the existing roads without creating traffic on the surrounding freeway system.
I recently visited a test facility in Lubbock, Texas where Group NIRE has connected 3 Megawatt wind turbines directly to the distribution grid. Notably, each wind turbine has to be tied into a different substation so that the power generation doesn’t overwhelm demand.

Are there other infrastructure costs the smaller utility-scale solar projects require? Answering this question requires a better understanding of the distribution grid.
Regulators and utilities in California and Hawaii are carefully analyzing how solar energy can integrate into the distribution grid. The studies are worth looking at to understand the best-case scenarios for connecting solar.
In California, regulators are requiring utilities to go circuit-by-circuit and estimate the capacity for the grid to accommodate more solar without triggering upgrades over the next ten years. In these cases the cost of adding solar is zero, and hopefully there’s even a benefit. The available capacity is referred to as integration capacity or hosting capacity.
This analysis will be very important to understand the impact of smaller utility-scale projects on the grid. Here’s a quick overview of what they’re doing.
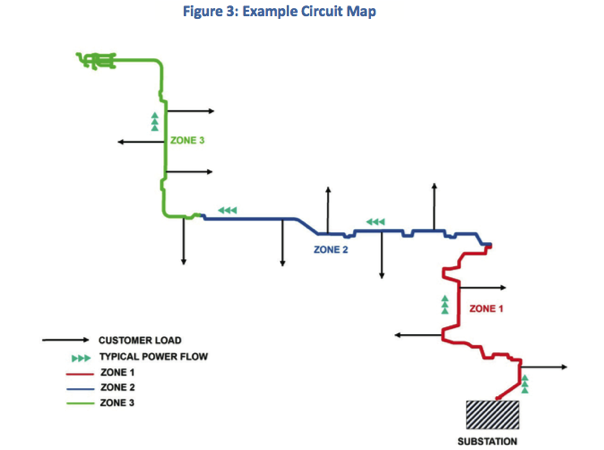
It’s a big, engineering-driven modeling exercise. The utilities have a combined 8,800 circuits to study. Each circuit is being broken down into multiple segments. The figure below from San Diego Gas & Electric’s Distribution Resource Plan shows how they break a typical circuit into three sections.
The utility needs to worry about several technical constraints on each circuit:
- Circuit voltage needs to stay within a prescribed band so that connected equipment is not damaged. Solar can potentially cause unwanted voltage changes.
- The temperature of circuit equipment, such as transformers, needs to stay within manufacturer ratings so that it does not fail or cause fires. Solar energy could potentially subject equipment to more than typical flows of electricity, and flowing electricity creates heat.
- The utility needs to be confident that the circuit breakers and fuses that protect equipment and public safety in the face of short circuits continue to operate as intended. Solar energy could potentially keep fuses from operating as intended.
The analyses are still underway, but San Diego Gas & Electric (SDG&E) has estimated that their grid can accommodate about 1,000 Megawatts of distributed generation. That’s equal to around 20% of the utility’s peak demand.
SDG&E’s distribution grid may, or may not, be similar to other utilities’ grid. But if every utility’s distribution grid has hosting capacity equal to 20% of peak demand, then the six sunny states in the southwest US (CA, NV, AZ, CO, UT, NM) could accommodate nearly 24,000 Megawatts of solar without triggering distribution-level investments (20% of 118,000 Megawatt summer peak demand). That amount of new solar capacity would nearly triple the amount of solar photovoltaics in those states.
Increasing hosting capacity further only requires modest investments in many cases. A 2015 Energy Institute at Haas working paper, described here, performed a detailed analysis of Pacific Gas & Electric’s distribution grid and concluded that solar penetration equal to 100% of capacity on all circuits would require only small cost to accommodate.
Each utility has produced circuit-by-circuit maps that show hosting capacity. If you enjoy poking around maps like I do you can find them here, under the section “Integration Capacity Analysis (ICA) Maps”.
The utilities in Hawaii and some public utilities in California have also been undertaking hosting capacity analyses.
Smaller utility-scale solar projects could grow as a very important part of the renewable electricity mix. Policymakers should make sure they understand how to bring these projects onto the grid at the lowest possible cost. A good place to start is to pick up the analytical approaches being developed in California and Hawaii and do similar analysis in other sunny regions.
Categories
Andrew G Campbell View All
Andrew Campbell is the Executive Director of the Energy Institute at Haas at the University of California, Berkeley. At the Energy Institute, Campbell serves as a bridge between the research community, and business and policy leaders on energy economics and policy.

LBNL separates its solar price analysis into residential / utility-scale
Here’s the latest residential update:
http://newscenter.lbl.gov/2015/08/12/solar-prices-fell-2015/
Andrew, you’ll be the hero of the residential solar crowd when they read your headline and then they will be crest fallen to read the actual article 🙂 BTW this is exactly where we focused as Recurrent Energy we’ve built hundreds of MWs about 20MWs at a time. I haven’t looked at the study, but if they haven’t taken into account the existing queue of IC studies at distribution level, they may find that things are a bit more “played out”.
The claim is that utility grid renewables is the the way to go due to cost savings. Not so true after all. Transmission charges look like they will become a large share of grid costs—something we forecasted 4 years ago.