What’s Not Crushing California Rooftop Solar?
Bill savings from residential PV are as large now as a few years ago, but the industry is facing other big challenges.
2019 was a good year for residential solar in California. In the service territories of the three large investor-owned utilities – Pacific Gas & Electric, Southern California Edison, and San Diego Gas & Electric – the industry installed over 800 MW of capacity, up 14% from the prior year. The industry leader, SunRun, saw its stock price rise nearly 40%. The California Solar & Storage Association (CalSSA) celebrated hitting 1 million solar rooftops in the state and their annual report gleamed with optimism.
Fast forward to today and the media is filled with articles about the catastrophic decline of the industry. Most of the blame centers on the change in compensation for electricity that solar homes sell to the grid, which was implemented last April. CalSSA is shouting from the apparently barren rooftops that the California Public Utilities Commission is driving a stake through the heart of the industry with this policy shift.
(Source, but altered by the author)
But a closer look at that policy change – as well as the recent eye-popping residential rate increases – leads to a very different conclusion.
Every household that got a permit for a new solar system prior to April 15, 2023 locked in credit for its electricity generation at the retail electricity rate, under what was known as “NEM 2.0”. Systems permitted after April 15 are covered by “NEM 3.0”. They receive a much lower rate when the household exports electricity to the grid, but these customers still save the full retail rate when the power is used on site.
That last detail is important, because when you do a little math, it turns out that the bill-savings incentive to install solar today under NEM 3.0 is about the same or greater than it was for most households in 2019 under NEM 2.0.
How could that be? Well, even without a battery, the typical solar household exports about 50% of its rooftop output to the grid (the Solar Energy Industry Association says it’s 20%-40%) . So, while the new policy cuts the value of exports, the higher retail rates greatly increase the value of the electricity used on site. Here’s a link to my calculation spreadsheet. Even at a 50% export rate, it indicates that the solar incentive is slightly higher in 2024 than it was in 2019 for SCE and PG&E customers. It’s about 38% lower for SDG&E customers, though SDG&E is about 80% smaller than the other two and it already had by far the highest rates and solar penetration in 2019. (And that is based on the surprising 2024 decline in SDG&E rates, which is not expected to persist.)

(Source: For 2014-23, EIA-861 data with revenue adjusted for semi-annual Climate Credit. For 2023 and 2024, Utility Advice Letters.)
These calculations encompass a number of assumptions that are made clear in the spreadsheet. Possibly the most important is that households will consider only 2024 rates in making the adoption decision. Since rates are expected to rise faster than inflation for at least the next few years, this probably understates today’s incentive for a forward-looking customer.
Sure, the incentive to install isn’t as great for any of these customers as it was on April 14, 2023, when NEM 2.0 was about to end, but overall it isn’t that different from a few years ago when the industry was doing just fine, throwing itself parties, and growing at a healthy pace. The policy change has just stepped us back from the recent exponential growth in new systems, which is now creating exponential growth in cost shifts onto other ratepayers.
What’s “crushing” solar?
But if the incentive is still robust, why have new sales dropped off so much in the last year?
The first and most obvious reason iseverins that the much more generous compensation for systems installed before April 15 drove a goldrush during the first three and a half months of 2023. Many of those early-2023 buyers would most likely have been later-2023 buyers were it not for the rush to install before April 15 and lock in NEM 2.0 rules. In fact, overall 2023 sales of residential PV capacity were slightly higher than 2022.
But there remain a number of other drags on residential PV sales, factors that had been masked by the unprecedented growth in financial incentives from retail rate increases and NEM 2.0 policies.
It’s the interest rates
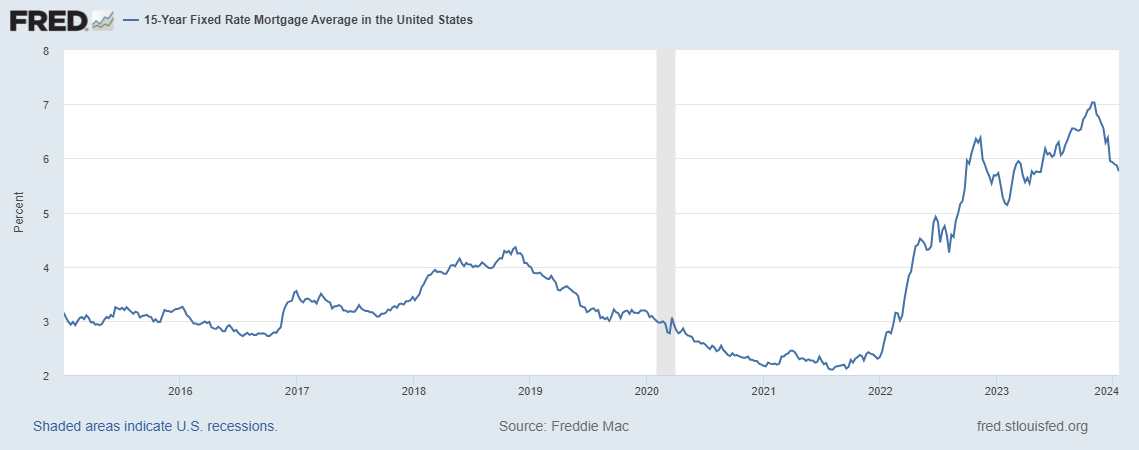
Rising interest rates makes any upfront capital investment that pays off gradually over decades less attractive. In fact, if a new solar system were financed at mortgage interest rates over 15 years, a buyer in 2023 would see a 21% higher monthly payment than a buyer in 2021 even though there was a slight decline in the cost of rooftop PV over the period.
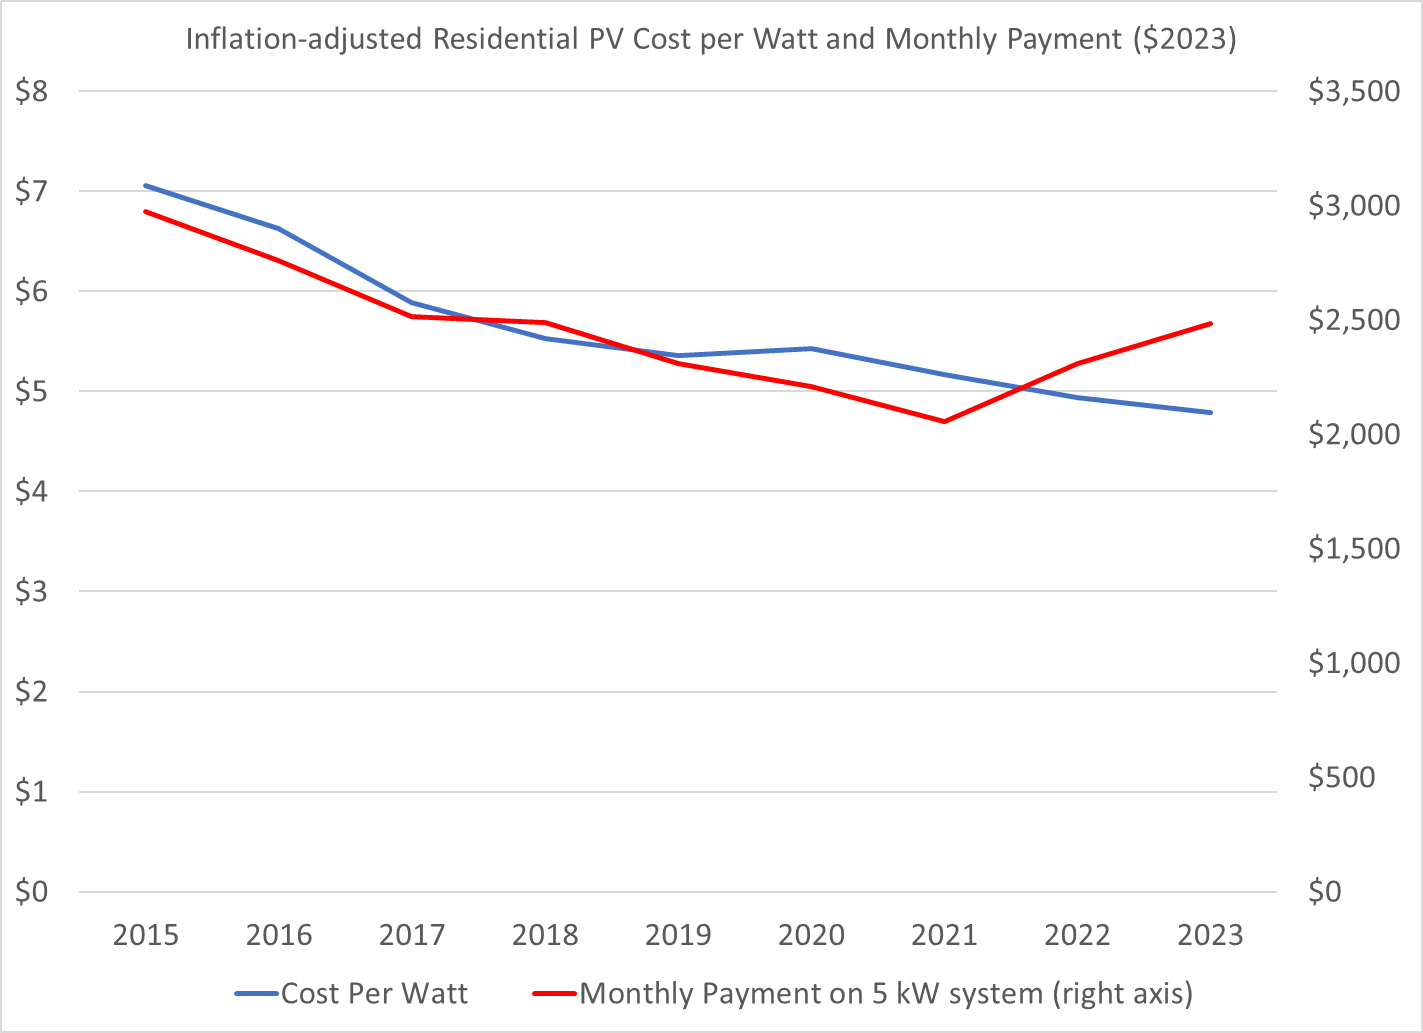
(Source: Author calculations based on data from californiadgstats.ca.gov)
The big winners have already gone solar
Households considering solar differ in many ways, such as their roof size and orientation, their total electricity usage, their ability to finance a big capital investment, and their interest in environmental causes. The folks who jumped at rooftop PV over the last 10 years were the ones with the best sites, the highest electricity usage, access to low-cost financing, and the most interest in fighting climate change. A rooftop solar system lasts decades, so to maintain sales, companies have to convert new customers who were not that interested a couple of years ago. That makes it harder to keep up the growth year after year.
Slowdown in power shutoffs
In its 2019 “Year in Review” report, the Solar Energy Industries Association reported that “A crucial driver of growth for residential PV has been the public-safety power shutoff (PSPS) events in California. Beginning in H1 2019, these power shutoffs provided a key incentive for homeowners to purchase solar, increasingly paired with storage.” Back in fall 2019, so many people were asking how to deal with the PSPS disruptions that we had two different Energy Institute blog posts addressing the question.
Overall, from 2014 to 2019, the residential solar business in California grew at a 14% annual average rate. Then, after a flat 2020 during the pandemic disruption, sales exploded, more than doubling by 2022.
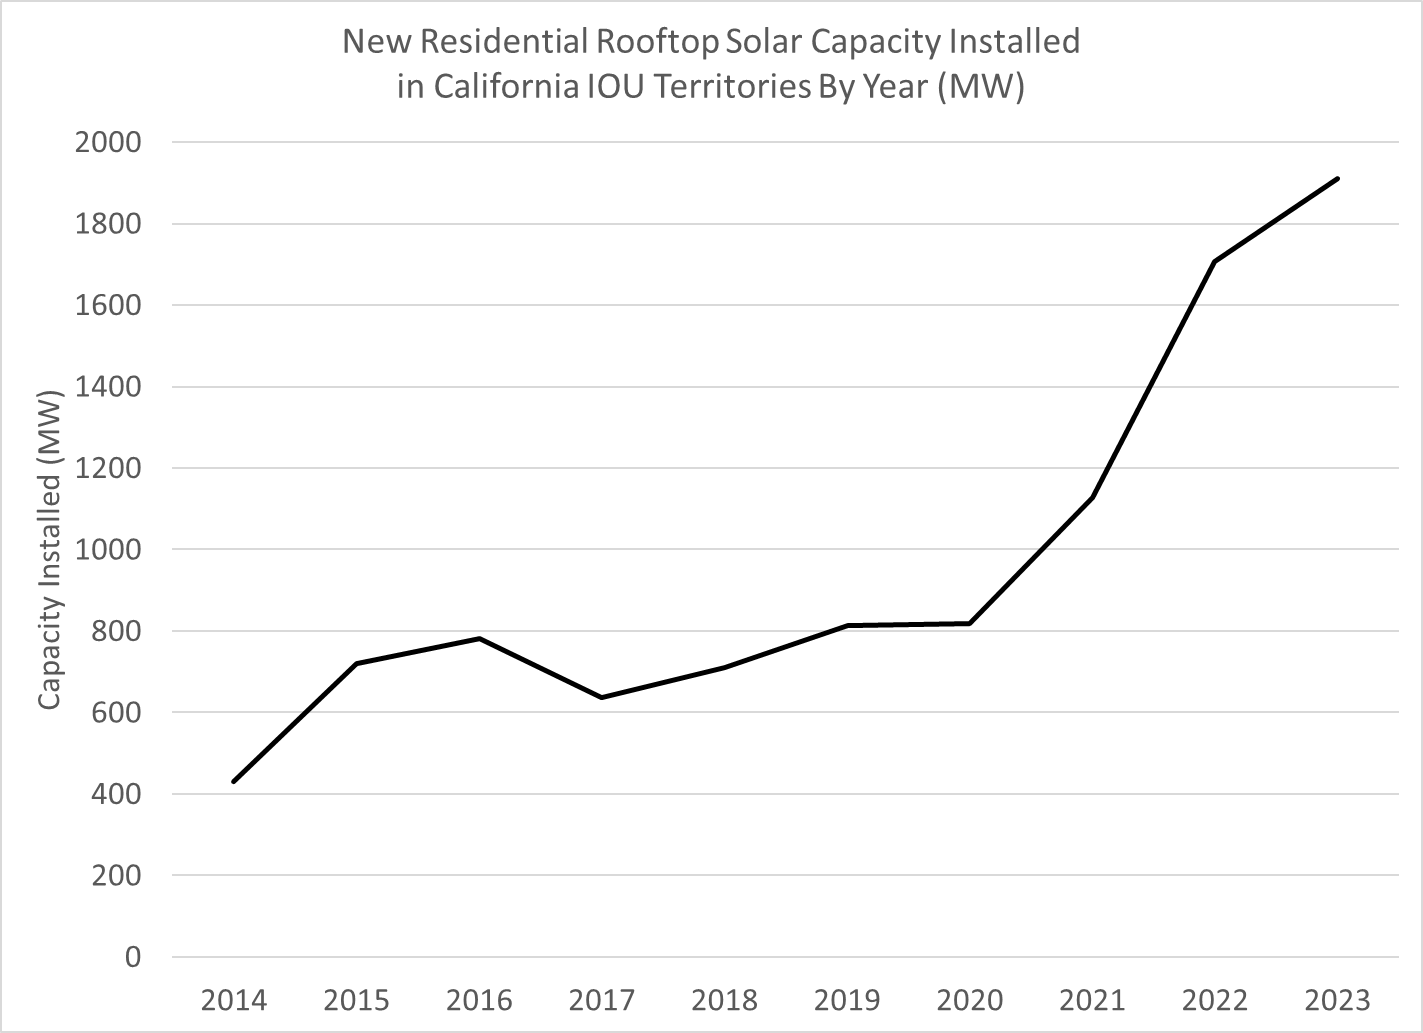
(Source)
PSPS events, however, have greatly diminished in the last couple years, in part due to better luck with the weather and in part because utilities have figured out how to shut off fewer houses when they have to deenergize a risky line. Fewer homes hit by PSPS events means fewer going solar (plus a battery) to minimize the disruption of blackouts.
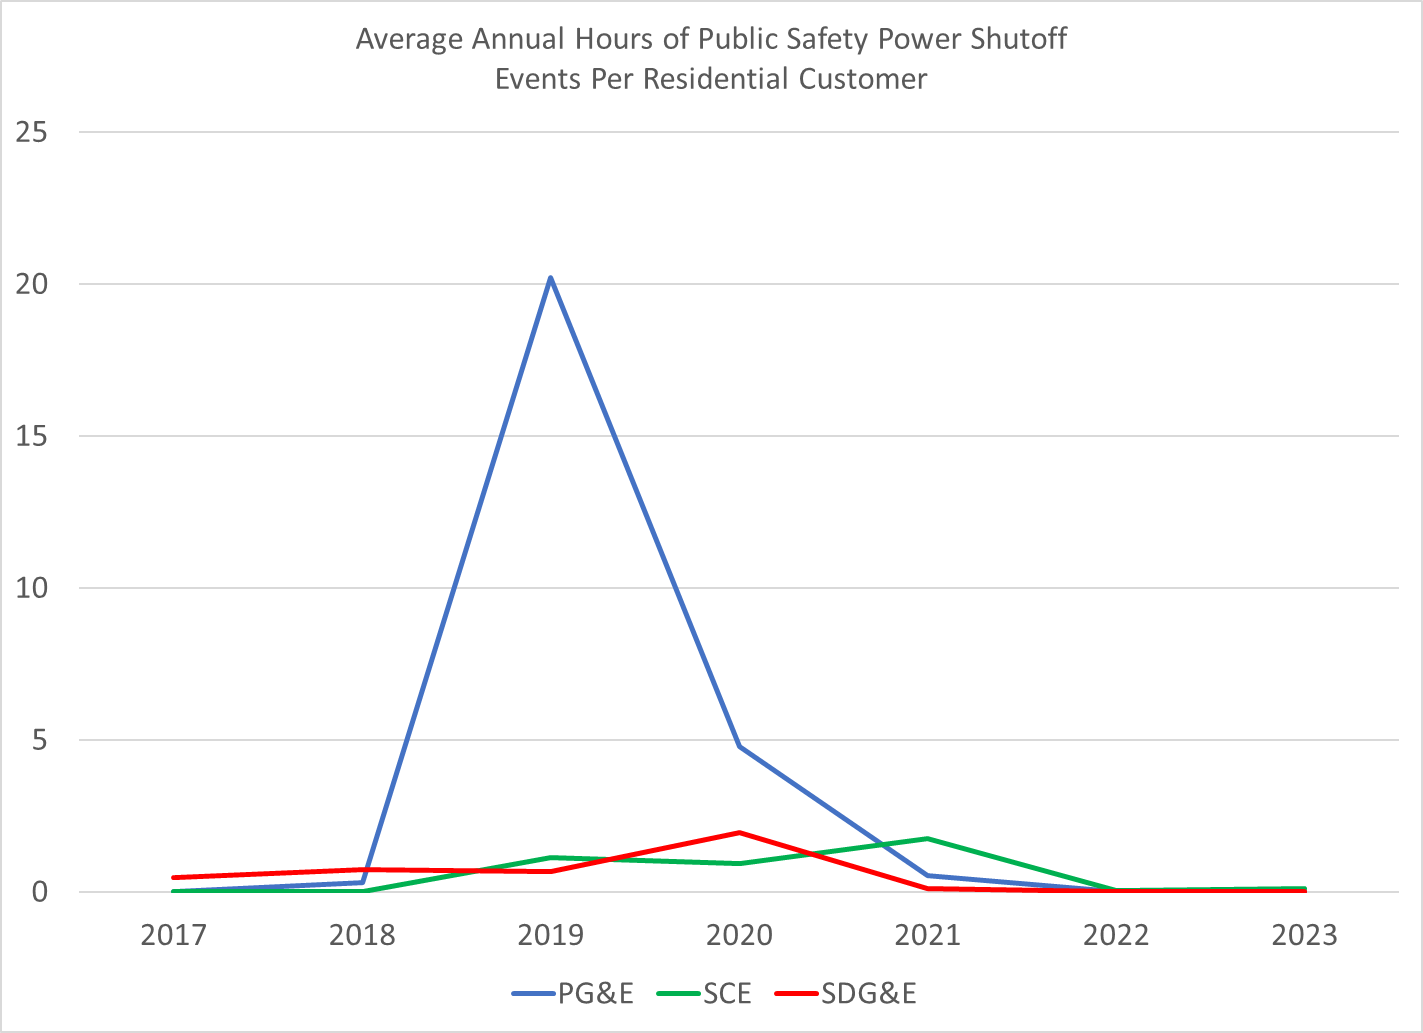
(Source: Author calculations from the CPUC’s spreadsheet of PSPS events)
Time to stop policy wobbling
There’s now a move in the California legislature to reinstate the NEM 2.0 policy. This would override the CPUC NEM 3.0 decision, which was based on an extensive hearing process and careful reasoning to move compensation for rooftop solar in a more sustainable direction. With the drastically higher retail rates we now have, returning to full net metering would be a massive rooftop solar subsidy paid for by other – generally poorer – electricity customers. It would also drive rates much higher, making building and transportation electrification less affordable.
The rooftop solar market isn’t dying. It is coming down from the 2021-2023 sugar rush when net metering policies combined with rapidly-climbing electricity rates, recent power shutoffs, and the impending switch from NEM 2.0 to NEM 3.0 to produce growth that simply couldn’t be maintained. It’s tough to unwind bad policy when it creates outsize benefits for a small group of consumers and investors that are paid for by everyone else. But if we don’t do it now, it will be even tougher to address in the future. It is vital for California to chart a path that is sustainable and equitable, so it can be an example for other regions to follow, not a cautionary tale of what to avoid.
[NOTE: I updated this blog slightly on 4/18/2024 to reflect changes in the calculation of the incentive for installing solar based on changes in my calculations of average residential rates. The conclusion is not changed.]
I am posting frequently these days on Bluesky @severinborenstein
Follow us on Bluesky and LinkedIn, as well as subscribe to our email list to keep up with future content and announcements.
Suggested citation: Borenstein, Severin. “What’s Not Crushing California Rooftop Solar?” Energy Institute Blog, April 8, 2024, https://energyathaas.wordpress.com/2024/04/08/whats-not-crushing-california-rooftop-solar/
Categories
Severin Borenstein View All
Severin Borenstein is Professor of the Graduate School in the Economic Analysis and Policy Group at the Haas School of Business and Faculty Director of the Energy Institute at Haas. He received his A.B. from U.C. Berkeley and Ph.D. in Economics from M.I.T. His research focuses on the economics of renewable energy, economic policies for reducing greenhouse gases, and alternative models of retail electricity pricing. Borenstein is also a research associate of the National Bureau of Economic Research in Cambridge, MA. He served on the Board of Governors of the California Power Exchange from 1997 to 2003. During 1999-2000, he was a member of the California Attorney General's Gasoline Price Task Force. In 2012-13, he served on the Emissions Market Assessment Committee, which advised the California Air Resources Board on the operation of California’s Cap and Trade market for greenhouse gases. In 2014, he was appointed to the California Energy Commission’s Petroleum Market Advisory Committee, which he chaired from 2015 until the Committee was dissolved in 2017. From 2015-2020, he served on the Advisory Council of the Bay Area Air Quality Management District. Since 2019, he has been a member of the Governing Board of the California Independent System Operator.

Get to Australian pricing levels for residential solar. At USD $0.65 / Watt fully installed, nobody has any reason to complain about NEM 2.0 v. 3.0, or the supposed “extra benefits” of residential solar that are not being captured in the calculations, or any of the ceaseless nonsense the solar installers and mindless solar activists flood us with. A combination of opportunistic price gouging by installers, over-regulation imposed by NIMBY neighbors and insane “safetyism” by local governments and self-interested IOUs is keeping our solar residential rates 3x or even 4x what they need to be. Yet as usual, people remain laser-focused on all the wrong issues while ignoring the one factor that would increase solar and battery deployment, increase renewable penetration, reduce pollution, and save more consumers more money.
I understand you are trying to defend the policy changes you did so much to promote, but you are completely out of touch with what’s going on now with rooftop solar in CA. You are correct that new solar installs and expansions increased based on the April 15, 2023 deadline for NEW 2.0, but that was just a permitting deadline. Many of those systems did not actually get installed until 6 months later or more. Mine was completed in March 2023, almost a year later. Once this backlog of work is done the rooftop installers are going out of business. Just ask them! Mine had exactly zero new customers after April 15, 2023. It is disingenuous for you to pretend that rooftop solar is going just fine now and you, personally, bear much of the responsibility for this change through your prior advocacy. You did not have to kill distributed generation to address inequities under NEM 2.0 but that’s exactly what you accomplished.
The amount of residential solar exports in this article (stated as 20% to 40%) is grossly understated. According to the CPUC’s own analysis, without batteries, net hourly residential solar self-consumption is about 40% of generation, and exports are about 60% of generation. In addition, NEM3 incorporated “Instantaneous Metering” (IM) which adds up to 10% more imports and exports, with additional cost to solar customers.
Hence, the cost savings for solar-only under NEM3 is not nearly as good as under NEM2.
I am at a bit of a loss to understand how EI-Berkeley could base an entire article on such grossly incorrect technical data.
To clarify to this anonymous commenter and anyone else who did not read the blog post very closely, I do not assume an export rate of 20% to 40%. Those are numbers that the solar industry has claimed. I assume an export rate of 50%. It would be great if commenters like this one actually posted links that support their claims rather than simply making assertions.
It seems that self consumption is the key assumption. Citing a study from 2010 and an offhand claim from SEIA isn’t persuasive. What IS the average self consumption of a CALIFORNIA, RESIDENTIAL, RATEPAYER??? Assuming an average CA home, needing 8000kWh/yr, typical location will require 5kW system. That system will produce 22kWh per day but most of it between the hours of 8am to 4pm. So if the residential load is flat, same every hour, then need to store or net meter about 16kWh every day on average, so only 27% self consumption without a battery. But the loads are not flat, they are heavily weighted towards the late afternoon and evenings, so much less self consumption without a battery. Self consumption using a battery isn’t free, it has to be subtracted from the NEM2.0 incentives for the comparison. 2 powerwalls would be well suited for this, 4kW/28kWh for a mere $16k. If they last 10 years, this adds $0.20/kWh ($16,000 / 10yrs/8000kWh/yr ) to the solar costs (e.g., the very rough breakeven value of using the grid for storage).
Seems like a more realistic assumption of self consumption is 25% in California for residential solar. Using the spreadsheet, at a 75% export rate, just as everyone is experiencing, apples-to-apples to 2019, the benefit declines 30%, a loss of $740/yr for the average residential ratepayer. Thus the dramatic drop in demand. If I add storage and export only 10%, the benefit improves by $1649, basically breaking even on the added installation costs of a 10 year battery) so need not be part of the calculus.
Unfortunately, all the quotes I received from solar installers put Powerwall’s and other battery storage at $12,000.00 to $15,000.00 per battery so storage could cost a homeowner $24,000.000 to $30,000.00 for a two-battery system totaling 21 to 28 kilo watt hour of storage. Only Tesla, if batteries are purchased with a “Tesla Solar Roof” gave two Powerwall’s for $18,600.000 as an “add on” to a $121,000.00 Tesla Solar Roof system.
To be clear, higher actual battery costs strengthens the point. If you don’t include batteries, then you don’t get the very high self consumption rate assumed in the spreadsheet. If you do include batteries, the added cost of batteries in order to get the high self consumption rate overwhelm the benefit. This all despite the new very high residential rates that were passed in the recent PG&E rate case. So just math, contrary to the article conclusion, using the article’s spreadsheet, the incentives have dropped a lot. It’s core assumption that 50% self consumption is not typical or reasonable without a battery, and with a battery it is way too expensive.So $8000 per Tesla Powerwall can be understood to be the maximum allowed price to break even. 4 years ago, I believe that’s what they were going for installed. In between Li-ion prices increased, so apparently the economics now are even worse. Of course $12000 for a 14kWh battery is much worse, nobody would do it for the economics.
So I am citing a research paper from Lawrence Berkeley National Lab and the solar industry itself while you are citing a number that you pulled out of your, uh, introspection. The 50% number I use is also consistent with PG&E’s filing based on meter data (https://www.pge.com/tariffs/assets/pdf/adviceletter/ELEC_6884-E.pdf). BTW, if I had actually use the SEIA number, the economics of rooftop solar would be much better today than in 2019.
HAHAH. Oh wait you were serious? yeah tell me you’re a PG&E shill without telling me.
This argument was resoundly debunked WELL before PG&E’s cronies in the gov’t stuck us with NEM3.
I mean, they got everything they wanted, basically killled solar in CA, and yet RATES CONTINUE TO GO UP. That right there tells you all you need to know.