U.S. Power Plant Emissions Down 45% Since 2010
Environmental damages from U.S. power plants are down $100+ billion annually since 2010.
Remember 2010? It was not so long ago. Obama was President. The iPhone 4 was introduced. The Hurt Locker won six Oscars. Congress passed the Affordable Care Act.
Yet, though it might be hard to remember, the U.S. electric sector in 2010 was very different. Nearly twice as much power came from coal as from natural gas. In total, U.S. power plants emitted 15 billion pounds of sulfur dioxide, nitrogen oxides, and small particulates.
Nobody predicted the power sector would transform so quickly. If you have been following electricity markets, you probably knew things were changing. We’ve all read about natural gas supplanting coal, and about the growth of renewables. But when you translate that into US power plant emissions, the impact is eye-popping.
A new paper by economists Stephen Holland, Erin Mansur, Nicholas Muller, and Andrew Yates, released today by the National Bureau of Economic Research, shows us how far the U.S. power sector has come.
Pollution Plummets
Holy cow, look at this figure.
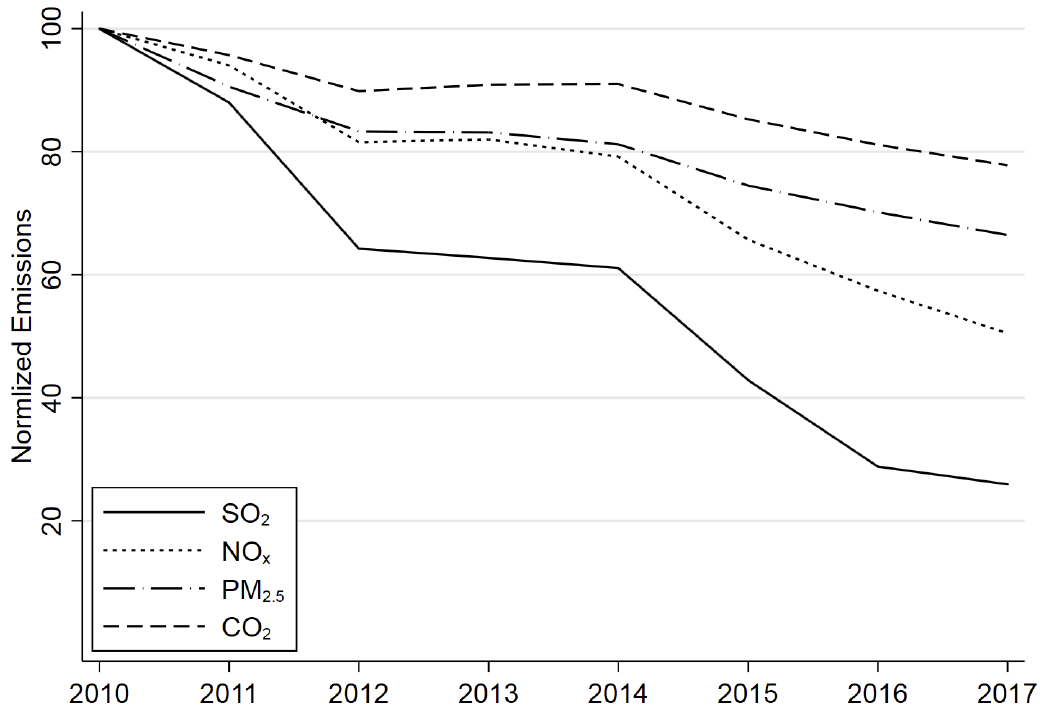
Wow! Nitrogen oxides (NOx), small particulates (PM2.5), and carbon dioxide (CO2) are all way down. But the decrease for sulfur dioxide (SO2) is stunning – down 75% since 2010. These pollutant reductions mean reduced asthma, heart disease, lung cancer, and a whole host of other significant benefits.
The authors measure the economic benefits of the decline using an integrated assessment model. Altogether, they calculate that damages from the U.S. power sector have decreased since 2010 from $245 billion to $133 billion (in real 2014 dollars). That is, environmental damages are down $112 billion per year – a 46% decline. Let me say again, “Wow!”.
Unpacking The Damage Reductions
They find that 88% of the damage reductions come from reduced sulfur dioxide emissions. The other pollutants matter too, but sulfur dioxide dominates the impacts both because it is so damaging and because SO2 emissions decreased so much during this period.
Moreover, the aggregate gains are almost entirely due to lower damages from coal. Burning coal is about 18 times worse than burning natural gas in terms of local pollutants, so even though natural gas generation has increased, this is massively outweighed by reduced damages from coal.

Overall, the authors disaggregate the damage reductions into three categories:
- About 40% from the shift to cleaner plants, e.g., coal to natural gas
- About 40% from emissions reductions at existing plants, e.g. scrubbers
- About 20% from less fossil fuel generation overall, e.g. more renewables
This disaggregation is particularly interesting. My impression is that we’ve heard a lot about the first and third categories, but less about the second category. And, of course, with sulfur dioxide there is a lot that can be done to reduce emissions including not only scrubbers and other emissions control equipment but also substitution to low-sulfur coal.
The authors don’t try to answer everything. In particular, they don’t try to causally disentangle how much of this transformation was due to cheap natural gas, versus policies like the Mercury and Air Toxics Standards or Renewable Portfolio Standards. There is some related work doing some of this (here, here, and here), but the exact attribution to individual policies is not easy.
Electric Vehicles Get Cleaned Up
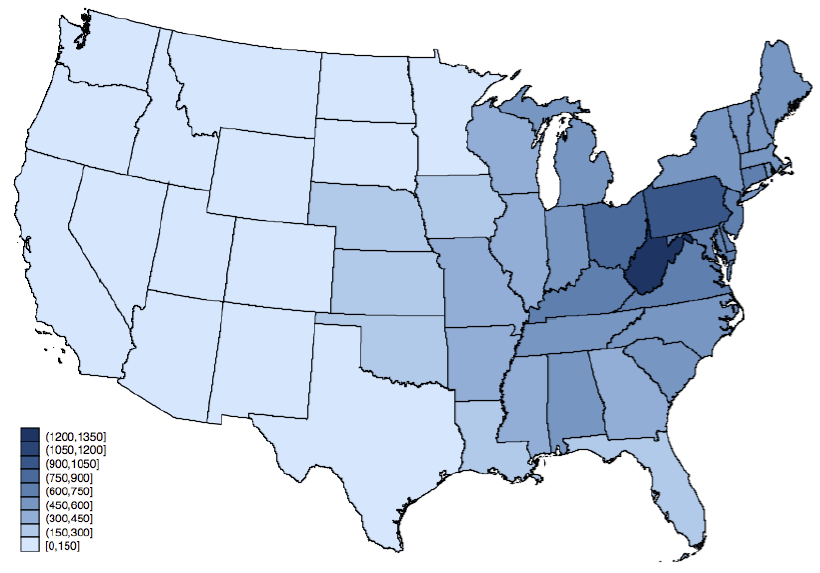
Almost everyone in the United States benefits from these pollution reductions. (Probably a lot of benefits in Canada and Mexico too!) But, their analysis is able to pinpoint the locations with the biggest reductions in pollution exposure. Most of the benefits are in the East, with residents of West Virginia, Pennsylvania, and Ohio at the top of the list.
Another, less obvious beneficiary is the electric vehicle sector. One of the consequences of a cleaner electric sector — is that EVs are now cleaner. In previous work, this same group of economists had shown that EVs actually increased air pollution damages in the Midwest and most of the East. No longer true. Now that the electric sector is cleaner, grid-powered EVs are cleaner than gasoline vehicles throughout the western United States and in virtually all cities of the eastern United States.
Recognizing the Progress
So in the United States have we “solved” electricity? No absolutely not. Damages from the U.S. power sector are still enormous and, in virtually all cases we have still failed to put a “price” on emissions. Moreover, carbon dioxide emissions have not declined nearly as much as emissions of local pollutants (NOx, PM2.5, and SO2).
But let’s take a minute and enjoy this good news. If not completely dethroned, King Coal is definitely on shaky ground. Moreover, existing plants are cleaner than ever – to a degree that I hadn’t realized. This is all good news for health and the environment.

For more see Stephen Holland, Erin Mansur, Nicholas Muller, and Andrew Yates, “Decompositions and Policy Consequences of an Extraordinary Decline in Air Pollution from Electricity Generation“.
Keep up with Energy Institute blogs, research, and events on Twitter @energyathaas.
Suggested citation: Davis, Lucas. “U.S. Power Plant Emissions Down 45% Since 2010” Energy Institute Blog, UC Berkeley, December 10, 2018, https://energyathaas.wordpress.com/2018/12/10/u-s-power-plant-emissions-down-45-since-2010/
Categories
Lucas Davis View All
Lucas Davis is the Jeffrey A. Jacobs Distinguished Professor in Business and Technology at the Haas School of Business at the University of California, Berkeley. He is a Faculty Affiliate at the Energy Institute at Haas, a coeditor at the American Economic Journal: Economic Policy, and a Research Associate at the National Bureau of Economic Research. He received a BA from Amherst College and a PhD in Economics from the University of Wisconsin. His research focuses on energy and environmental markets, and in particular, on electricity and natural gas regulation, pricing in competitive and non-competitive markets, and the economic and business impacts of environmental policy.

The analysis would be more informative if the upstream methane emissions associated with production of coal and, production and transport of natural gas are counted. It is undoubtedly a good thing that acid gas emissions from coal have been reduced, But the reduced coal use is not an end in itself from a climate perspective unless net GHG emission impact is assessed to account for GHG’s associated with fossil gas substitutes.
David Wooley
Goldman School of Public Policy
UC Berkeley
Coincidentally, the EIA’s “Today in Energy” for 12/11/18 had a nice summary of the same topic (but showing numbers going back to 1995):
https://www.eia.gov/todayinenergy/detail.php?id=37752
I agree that this is an important analysis and set of results – when put together, there is a ‘wow’ factor, although in the abstract, its not surprising given the decline in coal as a fuel for electricity generation. Coal is a very. dirty. fuel. – and this assessment doesn’t (as far as I can tell from a fairly terse report) account for the collateral non-emissions effects (mountain top removal, acid mine drainage, etc.). Not to say there aren’t collateral consequences attributable to other fuels.
What frustrates me about this work and other environmental/economic consequence assessments like it is our inability to integrate these impacts into public policy regarding energy generation and use. Its even true of some of the analyses presented at this blog site (about which I have complained before – the lack of recognition of ‘external’ costs). For my part, I will print out a copy of the Holland et al. paper and send it to Senator Joe Manchin (WV) whose state seems to benefit the most from the decline in the use of coal even though Manchin appears to be on the record as supporting an even greater use of coal as a fuel (I hold out little hope…).
Regarding the state-by-state benefits, I did a quick look at the Holland et al. paper to see how they accounted for local vs regional air pollution. Long-distance transport of air pollution from fossil-fuel fired generation has been studied fairly extensively and – for example – led to a better understanding of the phenomenon of acid rain (coal fired power plants in the Ohio and Tennessee river valleys are/were the biggest contributors to the acidification of lakes in upper NY and New England.). The paper is fairly obscure on this point – without my digging into the references describing their AP3 model which is supposed to account for transport modeling. Since the paper refers to “local pollution” (which seems to be done county by county…), I’m not clear how much regional pollution transport is reflected in the state-by-state benefits shown in figure 2.