Does Rooftop Solar Help the Distribution System?
An opportune moment to revisit a pair of prescient studies by Michael Cohen and coauthors.
A couple of months ago I wrote a blog post called “Why Am I Paying $65/year for Your Solar Panels?” Readers offered many interesting and, er, colorful responses. One of the objections was that my calculation failed to incorporate the benefits of rooftop solar to the distribution system.
“Utility scale solar does not provide the distribution system and line loss benefits that distributed solar provides.” – Jim Lazar, Regulatory Assistance Project
“For example, expensive utility transformers can get overloaded on hot summer days when people are using more energy to cool their homes. Rooftop solar can reduce strain on the system on these days, which extends the life of utility equipment and creates savings for everyone.” – Sean Gallagher, Solar Energy Industries Association
Today I want to dig into this argument. I review the evidence of distribution system impacts, focusing on a pair of peer-reviewed studies by Michael Cohen and coauthors. The studies find that rooftop solar does help the distribution system, but that the magnitude of the benefit is very small. When you actually quantify these benefits, they are way too small to be used as an argument to prefer rooftop solar over grid-scale renewables.
Peer into the Peer-Reviewed Literature
The pair of studies (here and here) are appropriately titled, “Effects of Distributed PV Generation on California’s Distribution System” Parts 1 and 2, covering engineering and economics. The first paper is by Michael Cohen and Duncan Callaway; the second paper is by Michal Cohen, P.A. Kauzmann, and Duncan Callaway. The papers were published in 2016, but are more relevant today than ever.
 Note: Michael Cohen is a recent PhD graduate of UC Berkeley’s Energy & Resources Group, and is Lead Developer at New Sun Road. Duncan Callaway is Associate Professor at UC Berkeley’s Energy and Resources Group and often discusses these topics at dinner with his wife (and fellow Energy Institute blogger) Meredith Fowlie.
Both studies are peer-reviewed. This matters. The peer-review process is not perfect, but it imposes a discipline on researchers. Both papers carefully describe all data sources, methods, and assumptions. Refreshingly, the papers are also upfront about potential limitations of the analyses, and don’t try to oversell their results.
What I like most about these two studies is that they are based on real data. Solar City provided the authors with 15-minute data on 7,000 California rooftop solar systems, and PG&E provided the authors with historical financial data on distribution system costs. The authors build a numerical power flow model, and the analyses are grounded by these data from actual solar customers and an actual utility.
Deferring Capacity Investments
Probably most importantly, rooftop solar potentially allows the utility to defer capacity investments like transformer banks and conductors. Cohen and coauthors quantify this benefit by simulating increased rooftop solar penetration for a representative set of California feeder locations. Then they “levelize” these savings as benefits per kWh of rooftop solar generation.
Source: Cohen, Kauzmann, and Callaway (2016).
The main finding, summarized in the figure above, is that capacity benefits are small. For most cases, capacity benefits are less than 0.2 cents per kWh. To put this in some perspective, typical California wholesale electricity prices are about 4.0 cents per kWh, and average retail prices are 19.0 cents per kWh. Thus the deferred capacity benefits are small compared to the energy value of rooftop solar, and tiny compared to what California solar customers receive with net metering.
Not only are the capacity benefits small, but Cohen and coauthors’ results imply that capacity benefits will shrink over time. As the figure above shows, capacity benefits decrease sharply with rooftop solar penetration. Why? Because as more and more solar is deployed, the net peak load gets pushed later into the afternoon and evening, making subsequent installations less and less effective for reducing peak load.
Reducing Energy Losses
Another distribution system benefit you hear about is reduced energy losses. When electric current travels through the distribution system, part of the energy is lost in the form of heat. Rooftop solar tends to reduce energy losses because electricity doesn’t need to travel as far.
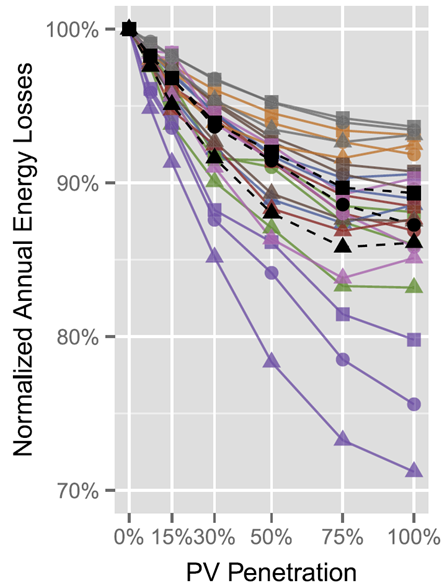 Source: Cohen and Callaway (2016).
As the figure above illustrates, Cohen and Callaway find that rooftop solar indeed reduces energy losses. With more and more rooftop solar, energy losses decrease by 10%, 20%, even 30% at very high penetration levels. The 24 different lines represent eight different types of feeders in three different cities. While in many cases the losses drop by just 10%, there are some cases where energy losses decrease by as much as 30%.
But let’s put this in perspective. While these are significant percentage reductions, they imply benefits that are small in absolute terms. Total energy losses in the distribution system are less than 5%, so even a 30% decrease means that total energy losses go from 5% to, say, 3.5%. Reducing waste is great, but this ends up being a small dollar value, worth less than 0.2 cents per kWh of rooftop solar generation.
An Elixir of Youth for Transformers?
Another category of possible benefits is reduced transformer aging. Rooftop solar could reduce the strain on transformers, potentially extending their effective lifetimes.
 Note: Pole-mounted transformers are used with overhead power lines, while pad-mounted transformers are used with underground lines.
This is a tough category to evaluate because there is not a lot of data on existing transformers. In practice, many transformers fail for idiosyncratic reasons (car accidents, lightning, etc.), so utilities historically have not done detailed data collection or monitoring. Most transformers are probably over-sized to begin with, which would limit the gain from reducing load, but this is not something for which there is good direct evidence.
Cohen and coauthors use their model to simulate impacts for a large set of representative locations. In general, they find very limited reductions in transformer aging. There are also a small number of locations where rooftop solar significantly increases transformer aging, driven by a surge of power back to the grid in places with large amounts of rooftop solar. Data constraints limit their ability to make definitive statements but, overall, this appears to be another category where the benefits are likely quite small. Cohen and coauthors also examine voltage regulation, and several other smaller categories of potentially benefits, in all cases finding the benefits to be very small or even negative.
Larger Benefits in Certain Locations
But wait a minute, aren’t there large (or at least larger) benefits in certain specific locations? Yes. Cohen and company find capacity benefits exceeding $60 kilowatt-year in the top 1% of all locations. This is about 10 times what they find for average capacity benefits. It makes sense that, for example, certain circuits are very close to needing a capacity upgrade, and that benefits would be large in these places.
This is very interesting. But it is also largely irrelevant from a policy perspective. We don’t have policies that can target certain locations. Net metering benefits all rooftop solar adopters – including those in the 1% of highest-value locations, as well as the other 99%. Federal tax credits benefit all rooftop solar adopters – including both the 1% and the 99%. There is no policy currently in place that allows for this kind of highly-granular pricing of rooftop solar benefits, so it is the average that is what matters for evaluating policy.
Too Little of Good Thing
Thus, overall, the Cohen studies find that the distribution system benefits of rooftop solar are small. The positive impacts probably exceed the negative impacts, but the overall magnitude is likely less than 0.4 cents per kWh.
What does this mean for California’s rooftop solar mandate? Like most energy economists including my colleagues Severin Borenstein and Jim Bushnell, I’m disappointed and perplexed by the policy. We know that residential rooftop solar is much more expensive than grid-scale renewables. At least 4 times more expensive, according to Lazard estimates.
Distribution system impacts don’t begin to close the gap. The Lazard estimate for the levelized cost of residential rooftop solar (midpoint) is 25.3 cents per kWh. If the distribution system benefits are 0.4 cents, this still leaves 24.9 cents per kWh. Compare this to 5.0 cents per kWh (or less) for grid-scale solar, and 3.0 to 6.0 cents for wind. It is not even close. The distribution system benefits are way too small to be used as an argument to prefer rooftop solar over grid-scale renewables.
 Note: Image licensed under creative commons.
Keep up with Energy Institute blogs, research, and events on Twitter @energyathaas.
Suggested citation: Davis, Lucas. “Does Rooftop Solar Help the Distribution System?” Energy Institute Blog, UC Berkeley, June 25, 2018, https://energyathaas.wordpress.com/2018/06/25/does-rooftop-solar-help-the-distribution-system/
Categories
Lucas Davis View All
Lucas Davis is the Jeffrey A. Jacobs Distinguished Professor in Business and Technology at the Haas School of Business at the University of California, Berkeley. He is a Faculty Affiliate at the Energy Institute at Haas, a coeditor at the American Economic Journal: Economic Policy, and a Research Associate at the National Bureau of Economic Research. He received a BA from Amherst College and a PhD in Economics from the University of Wisconsin. His research focuses on energy and environmental markets, and in particular, on electricity and natural gas regulation, pricing in competitive and non-competitive markets, and the economic and business impacts of environmental policy.

To compare the societal cost of electricity produced by residential rooftop solar with that produced by utility scale solar you don’t have to compare their respective LCOE’s. In fact, such LCOE comparisons are likely to be invalid because of errors introduced by incorrectly doing the LCOE calculation.
Great job! Got a nice and informative article to read. Thanks for sharing and keep posting:)
I have a few questions about this analysis. First, as Sean Gallagher and others have pointed out, rooftop solar has been credited by CAISO with avoiding billions of dollars in new transmission investment over the past 2 years alone. Why did you choose to ignore the ratepayer benefits of avoided transmission investment?
Second, the short-run energy cost (i.e. the $0.04/kWh wholesale market price you cite) is only one component of electric generation costs. Long-run generation capacity (fixed plant), is another cost component that can also be avoided by distributed solar. In fact, PG&E recently cited the growth of distributed solar in its decision to close the Diablo Nuclear Plant. Standard practice in avoided cost methodology is to use Resource Adequacy prices for near-term (1-3 years) avoided capacity and Cost of New Entry (CONE) for long-run avoided capacity. Why did you neglect to include any avoided generation capacity value whatsoever in your analysis? Did you consult any of the Standard Practice Manual avoided cost methodologies or the E3 calculator before determining that short-run energy costs are the only avoided cost category worth considering?
Third, new generation capacity in California tends to be needed only in specific congested, heavily-populated local areas where large-scale renewables cannot be sited, and where their energy cannot be delivered due to transmission constraints. For example, in the Oakland Clean Energy Initiative, PG&E and EBCE are looking to replace an aging fossil plant with preferred resources that need to be located in a congested urban area. Does your analysis consider that rooftop solar and other distributed resources might have higher capacity value than large-scale renewables by virtue of their ability to be sited in dense population centers and thus displace generating resources that would otherwise be needed in those areas?
Finally, you cite the Lazard’s costs of rooftop PV in criticizing the solar mandate. However, that study looks at the costs of retrofitting solar onto existing roofs, which is far higher than the cost of building-integrated PV (BIPV) on new construction. If you were to assume the capital cost of BIPV is equal to that of PV panels plus roofing materials, and the installation cost of BIPV is no greater than installing a regular roof on a new home, how does that effect your analysis/conclusions? Under those assumptions, how does the cost of the solar roof mandate compare to the cost of large-scale renewables? How does the cost-benefit of the two approaches compare when considering benefits of distributed PV that are not provided by large-scale renewables (like avoided transmission and avoided local generation capacity)?
To compare the societal cost of electricity produced by residential rooftop solar with that produced by utility scale solar you don’t have to compare their respective LCOE’s. In fact, such LCOE comparisons are likely to be invalid because of errors introduced by incorrectly doing the LCOE calculation.
Everyone likes to cite the Lazard LCOEs (even me), often without understanding their underlying assumptions. There are numerous problems with Lazard’s calculations but I will only address the two that affect their solar LCOEs. Firstly, Lazard assumes that nonresidential solar projects will be undertaken by for-profit entities that pay income taxes. Secondly, Lazard uses inappropriate discount rates to account for time and risk.
Assuming that a for-profit entity develops a project implies that the resulting LCOE will include a component to recover the income taxes the project will pay over its life. But income taxes are not a societal cost, rather they are transfer payments between different groups of people. Thus, Lazard’s LCOEs overstate the societal cost of nonresidential solar.
Lazard also overstates the cost of residential solar by using the same discount rate as for nonresidential solar. In fact, it applies the same discount to all project categories – even those employing fossil fuels whose future prices are very risky! This alone should be enough to disqualify Lazard’s LCOEs from serious consideration.
Lazard also overstates the cost of all solar energy by applying discount rates that are too high for renewables. This is because the costs to be recovered over the economic lives of renewable energy projects are known with certainty at the start of the project – and almost so before they even go into service, since the construction time is so short. The cost recovery risks of these projects almost entirely depend on two factors: (1) the lifetime and timing of the electricity output and (2) the future prices received for each unit of that output the resource’s electricity output.
Typically nonresidential renewable energy is sold under a long-term contract to a creditworthy buyer so the price is known with a high degree of certainty in advance. In contrast, residential solar is (effectively) sold to the utility (think superposition) at the customer’s retail tariff price, which is subject to future changes. Thus, the discount rate for nonresidential solar should be low, i.e., close to the 20-year US government bond interest rate, (which is around 3 percent – way lower than 10 percent) while the residential solar energy should be discounted at a somewhat higher rate (but still lower than 10 percent).
Lazard’s calculations assume the discount rate is equal to the selling entity’s weighted-average cost of capital (WACC). The validity of this short-cut method depends on several key assumptions that are typically not satisfied by standalone projects using debt financing. The more appropriate way to calculate the NPV of such projects is with the Adjusted Present Value (APV) method. (See Corporate Finance, by Brealy and Myers, for a discussion of APV).
So getting back to my initial comment, a comparison of the societal cost of electricity produced by residential rooftop solar vs. utility scale solar (or other nonesidential solar) is best done by just comparing their respective unsubsidized capital investments on a per- Wattdc basis.
The Q2 2018 data from GTM research estimates a capital cost of just under $3.00/Wattdc for residential rooftop solar, about $1.00/Wattdc for fixed-tilt utility solar costs and about $1.50/Wattdc for nonresidential (e.g., big box store rooftops) solar.
https://www.greentechmedia.com/research/subscription/u-s-solar-market-insight#gs.QAnyvs4
However, as some earlier commenters correctly pointed out, the cost of delivering utility-scale solar electricity to the load centers must be added to the project‘s capital cost. Unfortunately that cost can vary widely, depending on where the project is sited and whether the needed transmission upgrades will simultaneously serve load flows created by other generators.
(Actually, to the extent that a dedicated transmission line is needed for delivery it should be included as part of the renewable energy project’s cost and paid for by the developer – not socialized as was done for the Texas CREZ project. Other generators pay for their transmission interconnection and upgrade costs so why should renewable energy projects be treated differently? )
The Sunrise Powerlink project could add as much as $1.90Wattdc to the cost of utility-scale solar, effectively bringing the total to $2.9/Watt and roughly at parity with rooftop solar. But this seems like an extreme assumption because the Sunrise project was built to deliver not just solar energy but also geothermal and wind energy.
Geothermal energy is largely base load so it should bear the full $1.90/Watt cost. However, wind energy is mostly produced at night when solar isn’t generating so it can partially share the same transmission capacity with solar energy. This results in a joint-cost problem and the associated difficulty of determining how much cost to allocate to each project category. Clearly though, it is less than $1.9/Watt.
One other thought. The GTM Research data suggest that the sweet spot for solar energy production might be commercial and community solar, even though they cost about 50 percent more than utility-scale solar, because they do not require expensive dedicated transmission capacity to deliver their energy to the load centers.
Robert, I think this is a good description of the issues. As the to the transmission cost, in California, Sunrise probably is not atypical in California, e.g., Tehachipi and other SE desert lines. And it doesn’t include the further transmission investment required to get from the peripheral substations into the urban centers, which is usually buried in “reliability” upgrades. Transmission is very expensive here for several reasons.
I also agree that the best scale is that 100kW to 3 MW solar project, and community solar really would be optimal. But to do that will require breaking through the institutional barriers (e.g., minimum 500 kW for WDOT interconnection, utility intervention in project contracting) Maybe the threat of extensive rooftop solar will get the CPUC and the utilities to be more cooperative.
So what you are saying which seems to be true is that the very institutions wanting renewables to develop are also blocking that development with their rules. You would think they would flush these issues out and fix them.
As with all political institutions, they have conflicting objectives (e.g., accelerated renewable development vs. cost containment vs. labor and shareholder interests) that require that stakeholders present their cases for what balance is appropriate. It’s naive to think that decision makers will see this issue clearly and sort it out themselves without input from stakeholders.
Robert and Richard both make excellent points here.
The Institute for Local Self Reliance (Minneapolis) has done some work on solar economics, and found pretty much what Richard stated: that the optimal size for solar is the roof of a Wal-Mart or strip mall. That is, around 500 kW to 2 MW. Why?
a) Avoided transmission and transformation costs and losses, by injecting the power at the distribution voltage level vs. larger systems
b) Economies of scale in construction and maintenance vs. smaller systems.
and
c) Reduced air conditioning load when the systems are placed on the roof of air-conditioned commercial buildings. This last is among the least studied effects. One study from UCSD indicated that about 3 kWh of AC load (at the worst possible hours for the grid) is avoided for every 10 kWh of electricity generated. Makes some sense: any photon absorbed by the panel is one that does not hit the roof of the building.
This last piece may be huge. I’d like to see more published work on it. If any knows of any good studies, please send them my way: jlazar@raponline.org
Maybe the question is not the right one to ask. Shouldn’t we ask “Does rooftop solar help California transition off fossil fuels?” How rooftop solar affects rates depends on how the rates are designed and the services that are offered.
For some situations, the authors may have even overestimated the benefits of distributed solar. Imagine a bedroom community with high solar penetration. During midday the current reverses direction and is exported, albeit several times a day when the sky clears and gets cloudy again. The Dept. of Energy says that this may cause overheating of substation and other distribution assets, leading to more rapid depreciation. I am told that, in fact, the infra was not designed with reverse flow in mind and that its risks are not well understood. This is said to be one possible reason why NextEra wanted to come to Hawaii and experiment with conditions of high solar penetration.
Indeed Hawaii is experiencing reverse flow from residential subdivisions during the work day.
The experience so far has been that unless the sum of reverse from from various circuits does not exceed the minimum daytime load of the substation, the power simply goes out from the substation bus to other circuits.
But there are times when the substations are “running backwards.” Now, transformers are not generally very intelligent, but a bunch of coils of wire, so they work just fine as either step-down or step-up transformers. However, there are issues of voltage regulation that can be very important. There are two solutions to this. One is to install multi-tap station transformers, that auto-step to maintain the desired voltage on the receiving end. The other is to require smart inverters, that produce whatever voltage is needed to support the grid at any moment in time. Both are being used by utilities with high PV saturation.
But a more important effect in Hawaii is showing up in the commercial sector. Solar in Hawaii has shifted to commercial since residential circuit saturation has forced the end of traditional net metering. Hotels can simply install just enough solar to take their minimum daytime load to near-zero, and never export a single kWh. Their remaining “peak” is just a couple of hours in duration, and they can install batteries to shave that peak.
The same effect is being observed at big-box retail stores, like Wal-Mart, Costco, and Kohls. I wrote on this at:
https://www.raponline.org/blog/with-sinking-storage-costs-big-box-solar-could-really-take-off/
Nice blog post! I thought I would mention that we are starting to see policies that target certain locations. This is exactly what I’m doing with my solar field experiments with the utilities and the state in Connecticut – working with utilities to select the feeders most in need of upgrades and focusing the policy efforts (solar campaigns) in a randomly selected set of those feeders to quantify how much of an impact we might see on the need for upgrades, etc. One could imagine value of solar calculations for net metering that accounts for this. Different groups have different hypotheses about what we might find, and I’m looking forward to sharing the results in a year or two.
Very well articulated post. I agree regarding the distribution impacts and the blog makes a strong argument that they are unimportant. But, let us not forget transmission costs. The added transmission costs for utility-scale renewables can be large. For wind, these can be seen in public policy projects like CREZ in Texas and MISO’s multi-value projects. For solar, it is still early days for this development. But take a look at SDG&E’s sunrise powerlink transmission line. 1000 MW of transfer capacity at $1.9 billion dollars. At a 10% discount rate, 60 year useful life, and 28% capacity factor for its solar, that is a levelized cost of $80/MWh.
https://en.wikipedia.org/wiki/Sunrise_Powerlink
Of course, this one project doesn’t speak for all utility-scale solar but the point is that focusing on just the distribution system leaves a big and expensive component out of the conversation.
Good point. So if we adjust the Lazard results for available 6% financing to homeowners we get about $130/MWH, and we subtract $80/MWH in transmission costs for utility-scale solar, we get a net cost of $50/MWH. So this looks like a break even proposition.
cubed,
You conclusion appears correct. See my new comments on this topic.
Note that the CAISO has identifed in $2.6 billion in deferred transmission projects in is 2017-18 Transmission Plan. http://www.caiso.com/Documents/BoardApproved-2017-2018_Transmission_Plan.pdf
Will,
Excellent point. It has caused me to rethink my position on utility-scale solar. Clearly, the cost of moving utility-scale solar energy to the utility off take points on the grid has to be included as part of the cost of this resource.
See my earlier comments regarding Lazard’s LCOE estimates.
Thanks Robert! Yes your comments are well taken. I very much agree that assigning the full $1.9/W is inappropriate due to the sunrise’s ability to transfer other generating resources and its likely added benefit of increased reliability and reduced congestion.
Its very hard to determine cost responsibility on these system costs. I’m working on a project now to try to sort out these issues and provide these costs on a US wide basis.
I’m not sure I have the time to review the study closely enough (as that I’m not on a public salary), but I have several questions and observations.
First, I presume the study was conducted on PG&E’s overbuilt distribution system. PG&E made huge distribution investments through 2007 in anticipation of housing demand that never materialized, and then continued to request $2 billion in “growth” investment in its 2011, 2014 and 2017 GRCs despite the fact that there has been no growth. In fact PG&E, as shown in data requests I submitted in those cases, had no sophisticated distribution-level forecasting method that could have possibly accounted for the impact of added solar rooftops that would have shown up in its financial data. It’s hard to demonstrate a deferral benefit when the utility ignores that deferral benefit in its investment strategy. (This is only one of the numerous cases where PG&E has failed to appropriately manage its system.)
Second, the study likely ignores the much larger transmission deferral benefits that probably amount to more than $200/kW-yr based on work by Tom Beach at Crossborder Energy and submitted in the recent GRCs at the CPUC. That would add more than 3 cents per kWh in benefits.
Third, the Lazard study makes the bizarre assumption that rooftop solar would be financed with corporate capital finance parameters such as a 12% return on equity. (https://www.lazard.com/media/450337/lazard-levelized-cost-of-energy-version-110.pdf) Instead, these projects are financed either with a mortgage at ~4% interest or specific energy efficiency financing at 6% for a short period (we did the latter). That cuts the cost of rooftop solar substantially, in part by taking advantage of the financing available to the residential sector that isn’t available to corporate entities. (Our varied institutions make economic analysis complex, but those need to be accounted for as well.)
cubed,
You are right; the optimal way for a homeowner to finance rooftop solar was (before the recent tax law was passed) through mortgage or home equity debt that is tax-deductible. But this tax deduction is (was) a subsidy for solar.
Using subsidized debt financing does lower the cost of residential solar for the homeowner but it only by shifting those savings to others, e.g., the taxpayers. If we want to compare the societal cost of solar, or any other form of energy, we need to backout the effects of these subsidies.
In 2016 I completed a study that quantified the subsidies that a typical rooftop solar owner received through Net Energy Metering in calendar year 2015 (“Incentivizing Solar Energy: An In-Depth Analysis of U.S. Solar Incentives”). The analysis was replicated for the typical solar owner at each of 15 selected utilities.
The study excluded the benefits of reduced energy flows on the distribution systems because to do so would have required detailed load flow studies of 15 utility different distribution systems. My project budget and schedule was way too small for that.
Quoting from the final report:
“This report did not attempt to quantify the avoided costs associated with deferred investments in transmission and distribution assets or ancillary services, primarily because their contributions to total avoided costs are relatively modest, as a number of other studies have consistently concluded.28 For example, a recent report completed for Arizona Public Service Company concludes that the utility avoids essentially no distribution investment due to solar PV production because “Most of the feeders reviewed were residential feeders that typically peak close to sunset when solar PV production is greatly reduced.”29 For many utilities, the relationship between solar energy production and the timing of the distribution system peak load is similar to that of Arizona Public Service’s.”
The combined subsidy that the typical rooftop solar owner received through Net Energy Metering plus federal and state income tax credits, direct governmental payments, and artificially supported high REC prices, was so large that it is highly unlikely that the utility’s cost savings from deferred distribution asset investments would have significantly changed the overall picture. Even so, I was never comfortable with excluding these benefits because it was not based on a rigorous empirical basis.
The two studies that Lucas cites provide me with that comfort.