Heat Exposure and Global Air Conditioning
New paper ranks 219 countries and 1,692 cities based on air conditioning potential.
Air conditioner sales are booming worldwide, especially in warm countries with growing economies. But how big is the total potential market?
In a new paper, my coauthors — Leo Biardeau, Paul Gertler, Catherine Wolfram — and I rank 219 countries and 1,692 cities based on what we call “air conditioning potential”.
We find that India, China, Indonesia, Nigeria, Pakistan, Brazil, Bangladesh, and the Philippines all have more air conditioning potential than the United States.
Our results point to large potential increases in electricity consumption. The United States alone, for example, uses 400 terawatt-hours of electricity annually for air conditioning, about 1.5% of all the electricity consumed on the planet. Other countries currently use far less electricity for cooling — but this is changing rapidly as more people buy air conditioners.
Tallying the Heat
To construct our rankings, we compiled daily data for 2009-2018 from 14,500+ global weather monitoring stations, and used this to calculate cooling degree days (CDDs) for a 5km by 5km grid of the world. CDDs are a widely used measure of cooling demand calculated as the sum of daily mean temperatures above 18.3°C (65°F).
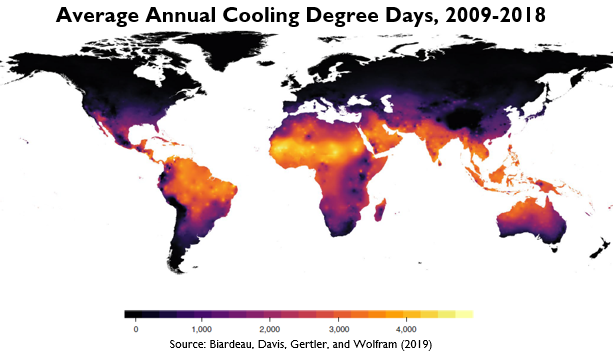
Vast areas of the planet are exposed to 3,000+ and even 4,000+ CDDs annually. As a point of comparison from the United States, even sweltering Phoenix has only 2,700 CDDs annually. The highest CDDs on the planet are found along a horizontal band passing through Northern Africa, the Middle East, and Southern Asia.
Accounting for Population
Next we calculated average CDDs for countries and cities. We wanted our measures to reflect the climatological conditions where people actually live, so we calculated “population-weighted” averages, by combining our information on CDDs with highly disaggregated population estimates.
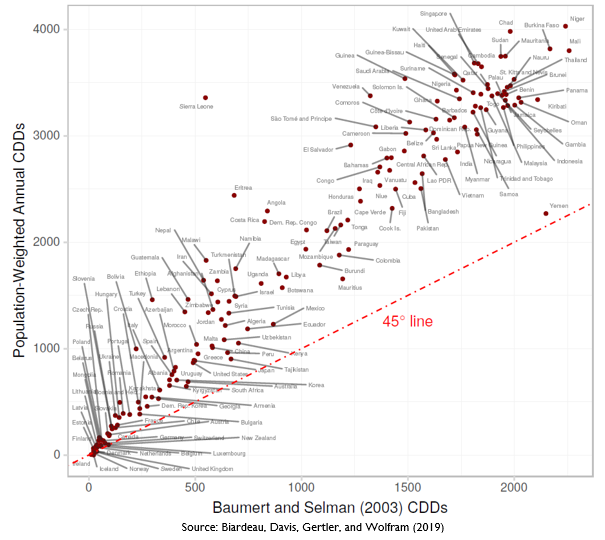
Virtually everywhere on the planet is considerably hotter than it was just two decades ago. To illustrate this, we compared our results to similar estimates made in 2003. In the figure below, virtually all countries are well above the 45 degree line. Higher CDDs reflect the global warming that has occurred over this period with nine of the ten hottest years in recorded history occurring since 2005, as well as other factors like the urban heat island effect.
Finally, we multiplied CDDs by population to get a measure of the “total CDD exposure” in each country and city. For example, India experiences 2,848 CDDs annually (population-weighted), and a population of 1.3 billion, so has total CDD exposure of 3.7 trillion. This measure of “air conditioning potential” has been used in previous studies (here and here) and can be thought of as the total number of CDDs experienced annually by a country’s (or city’s) population.
Country Rankings
Here are the top ten countries ranked by total CDD exposure.

India is at the top of the list with 28% of total global CDD exposure. Strikingly — this is 14 times the total CDD exposure for the United States. Compared to the United States, India has 4 times as many people and experiences an average of 3+ times as many CDDs. The city of Mumbai, by itself, has CDD exposure equal to 25% of the total CDD exposure for the entire United States.
There are eight countries with more total CDD exposure than the United States. Many of these have substantially smaller populations, but much warmer temperatures. For example, the Philippines has only one-third of the population but four times the CDDs, so ranks above the United States.
Except for the United States, all of the countries in the top ten have an annual gross domestic product per capita under US$10,000. As household incomes continue to rise across the world, we can expect these countries to adopt air conditioning in large volumes. Previous economic research has shown that technology adoption follows an “S” like pattern, so adoption can spike dramatically when income reaches certain thresholds. Several of the Top 10 are already middle income countries, so rapid air conditioning adoption is coming soon.
Potential vs Realization
There is, of course, a wide gap between “potential” and “realization”. Air conditioning is still uncommon in most low-and middle-income countries. As incomes rise, will these countries adopt air conditioning to the same degree as the United States? How fast? How many air conditioners? These questions have significant implications not only for electricity demand in emerging markets, but also for global carbon dioxide emissions, and thus future changes in global temperatures.

Keep up with Energy Institute blogs, research, and events on Twitter @energyathaas.
Suggested citation: Davis, Lucas. “Heat Exposure and Global Air Conditioning” Energy Institute Blog, UC Berkeley, December 9, 2019, https://energyathaas.wordpress.com/2019/12/09/heat-exposure-and-global-air-conditioning/
For more see Biardeau, Léopold T., Lucas W. Davis, Paul Gertler, and Catherine Wolfram. “Heat Exposure and Global Air Conditioning” Nature Sustainability, December 9, 2019.
Categories
Lucas Davis View All
Lucas Davis is the Jeffrey A. Jacobs Distinguished Professor in Business and Technology at the Haas School of Business at the University of California, Berkeley. He is a Faculty Affiliate at the Energy Institute at Haas, a coeditor at the American Economic Journal: Economic Policy, and a Research Associate at the National Bureau of Economic Research. He received a BA from Amherst College and a PhD in Economics from the University of Wisconsin. His research focuses on energy and environmental markets, and in particular, on electricity and natural gas regulation, pricing in competitive and non-competitive markets, and the economic and business impacts of environmental policy.

4 thoughts on “Heat Exposure and Global Air Conditioning” Leave a comment ›