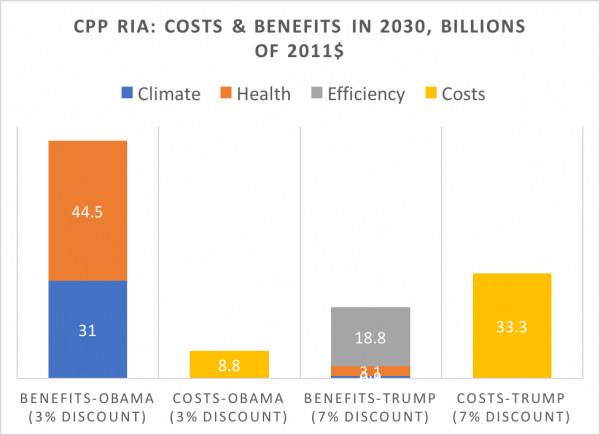
Posted November 5, 2017 graph Sources: Obama RIA (Tables ES-7 and ES-19); Trump RIA (Table 1-3 and 1-8); Percentages indicate discount rate used. ‹ Return to post Next Image