Is Solar Really the Reason for Negative Electricity Prices?
Solar gets all the attention, but another explanation is at least as important.
Even during extreme promotions like “Black Friday” and “Cyber Monday”, it is rare to see anything sold for a negative price. Low prices, sure. But truly negative prices are rare. You only see this when a seller is really desperate to get rid of something. 1-800-GOT-JUNK made $200 million in revenue last year getting paid to haul away junk. Turns out all that stuff in your attic isn’t priceless after all — it has a negative price.

Source: 1800gotjunk.com. Look how happy this guy is about negative prices.
This Spring, California electricity generators have been doing the electricity market equivalent to calling 1-800-GOT-JUNK. Between March and July, there were over 100 hours in which wholesale prices were below zero. These negative prices have received lots of attention, and the discussion has almost universally attributed negative prices to California’s ramp up in solar generation.
Solar is indeed part of the story, but another explanation is at least as important. Over the last decade, hydro, not solar, has been the primary driver of negative electricity prices in the United States. The year 2017 is no exception. Spring 2017 was among the rainiest in history, and it is this combination of hydro and solar that has pushed prices below zero.
Let’s Look at the Data
So far in 2017, California wholesale electricity prices have been negative in 2.5% of all hours, more than 130 total hours.

Note: This figure was constructed by Lucas Davis (UC Berkeley) using hourly wholesale prices from SNL Financial. The underlying data are complete for NYISO, MISO, PJM, and ISONE, but start in 2009 for CAISO, and in 2010 for ERCOT so there may have been negative prices in those markets prior to those years. Also, for 2017 data is only available until mid-August, so the percentage is calculated over only part of the year.
Increased solar generation is definitely part of the explanation for what’s happened in California in 2017. Solar capacity in California, including both distributed and utility-scale systems, has grown from less than 1GW in 2007, to 14 GW today. Also, the timing of negative prices in 2017 points squarely at solar. Negative prices peaked in March and April between noon and 5pm, on sunny days with high levels of solar generation.
Make it Rain
But for me the big surprise in the figure above is 2011. Although it didn’t receive as much attention, there were over 100 hours during 2011 with negative electricity prices in California. But why? Back in 2011 there was just a fraction of the solar generation that we have today. So what pushed prices below zero?
The answer is hydro. The two wettest years in the last decade? 2011 and (probably) 2017. During just the first 5 months of this year California has already generated 22 million MWhs from hydro, about equal to typical hydro generation for an entire year. If the rest of 2017 matches hydro generation from last year, 2017 will end up being the second highest hydro year in the last decade.
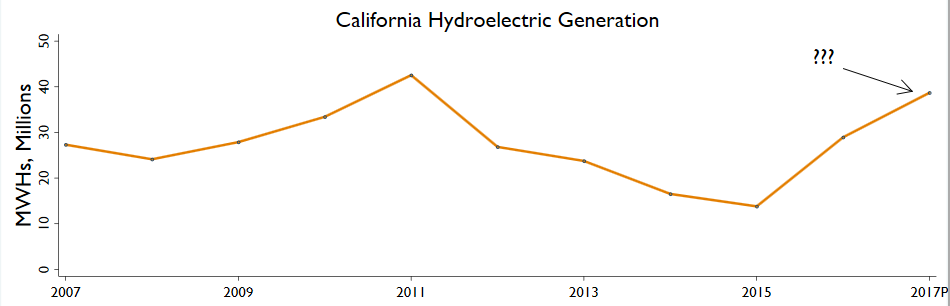
Note: This figure was constructed by Lucas Davis (UC Berkeley) using annual California hydroelectric generation from EIA. The prediction for 2017 uses actual generation Jan-May and Jun-Dec generation from 2016.
Interestingly, the negative prices in 2011 are very different from the pattern in 2017, and very much fit the pattern for hydro. In 2011, negative prices peaked in May and June, considerably later in the year than in 2017. Also, 60% of negative prices in 2011 occurred between 4am and 6am, wee morning hours when electricity demand is at its lowest level.
Another Example
Northwest power prices provide another good example of U.S. electricity prices responding to hydro. The year 2011 was a record year for hydro generation up and down the west coast, and in the Pacific Northwest prices were often negative. The Northwest doesn’t have an ISO so I didn’t summarize these prices in the graph above, but a couple of years ago EIA made this nice figure:
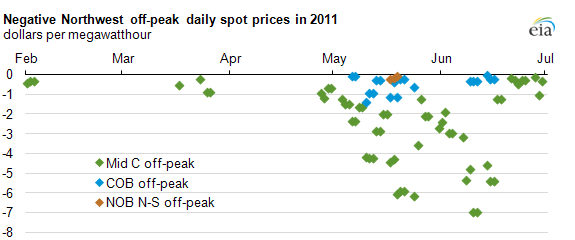
Source: EIA, Today in Energy, “Negative Prices in Wholesale Electricity Markets Indicate Supply Inflexibilities”.
Off-peak prices were frequently negative during Spring 2011. This was particularly true at the Mid-Columbia Hub (“Mid C”), right at the Washington/Oregon border. Washington and Oregon both have large amounts of hydro generation, so during rainy years supply can outstrip demand resulting in negative prices.
California, Oregon, and Washington lead all U.S. states in hydroelectric generation and it is no coincidence that negative prices have occurred most often in these states. Contrast this with Texas, for example. I was surprised in the figure at the top of the blog to see virtually no negative prices in ERCOT. Texas has twice as much installed wind capacity as any other state so you might have expected to see negative prices during high wind periods. This may well happen in specific transmission-constrained locations (e.g. West Texas), but negative prices throughout the state are rare.
Why Not Just “Spill” Water?
But why are hydro generators calling 1-800-JUNK? Why don’t hydro operators instead just leave the water in the reservoir? Or “spill” water without running the generators? During these negative price hours, hydro owners are paying money to produce electricity – why? Why, for example, on April 9th of this year was so much hydro operating in the middle of the day, even while wholesale prices were negative?
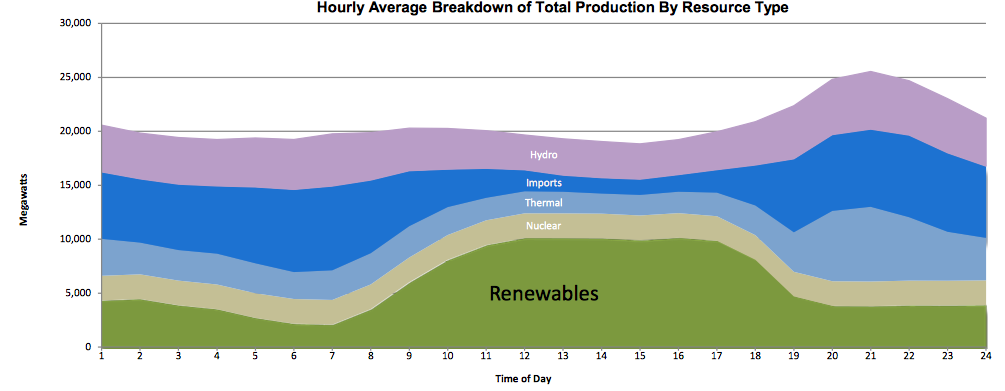 Source: CAISO Daily Renewables Watch. This figure shows hourly generation in California on April 9, 2017.
Part of the answer is that many hydro facilities are “run of the river”. Don’t think Shasta Dam. Think small-scale facilities in which the natural flow of the river is used to generate electricity. Negative prices weren’t even envisioned when these facilities were first built, so many lack the ability to “spill” water when necessary and presumably it is very expensive to retrofit these facilities.
But large facilities like Shasta Dam are more puzzling. While it is true that these facilities are limited in how much water they can store, it is not clear this should matter. Nor should it matter if there are minimum and maximum flow constraints. When prices are negative, large hydro facilities should always be able to “spill” water and this would seem to be preferable.
 Source: California’s Shasta Dam, public domain image.
This leaves me wondering whether there is something else: operational, legal, or contractual keeping these facilities running even when prices are negative. In the Northwest, dam operators have limits on how much they can “spill” because it churns air into the water which is bad for fish. Perhaps there is some similar regulation for California dams.
So my colleague Catherine Wolfram was right when she wrote back in March about the sinking duck. Water does have a lot to do with negative prices. Solar alone would not have driven such levels of negative prices this year if it hadn’t happened on top of near-record levels of hydro generation. In some sense, hydro can be even harder to turn off than wind and solar.
Keep up with Energy Institute blogs, research, and events on Twitter @energyathaas.
Suggested citation: Davis, Lucas. “Is Solar Really the Reason for Negative Electricity Prices?” Energy Institute Blog, UC Berkeley, August 28, 2017,
https://energyathaas.wordpress.com/2017/08/28/is-solar-really-the-reason-for-negative-electricity-prices/
Categories
Lucas Davis View All
Lucas Davis is the Jeffrey A. Jacobs Distinguished Professor in Business and Technology at the Haas School of Business at the University of California, Berkeley. He is a Faculty Affiliate at the Energy Institute at Haas, a coeditor at the American Economic Journal: Economic Policy, and a Research Associate at the National Bureau of Economic Research. He received a BA from Amherst College and a PhD in Economics from the University of Wisconsin. His research focuses on energy and environmental markets, and in particular, on electricity and natural gas regulation, pricing in competitive and non-competitive markets, and the economic and business impacts of environmental policy.

“What an economist would ask though, is why not structure a richer contract that aligns [hydro] operational incentives with wholesale prices?”
Even short of real-time pricing, isn’t there a way to solve this on the demand side? Contract w/ large users and demand aggregators (e.g. w/ remote control of water heaters, batteries refrigeration etc.), such that the system operator can increase load when there is a surplus. Just as users are paid to enter voluntary load-curtailment agreements, some would presumably pay to enter into voluntary off-take agreements. (One can imagine regulated distribution-utilities resisting such a proposal, however.)
Jim, you are on to something there. But let’s not forget, especially in California, water has always needed to be managed with the number of constrains, demands, etc., as will be needed (desired) in a Grid 2.0 or even Grid 3.0 system.
Whatever is earned from electric generation is almost gravy in the overall calculations, given both the demand & supply side considerations. Water systems don’t have to function/respond in the degree of ‘real-time’ as an electric system, but satisfying a long list of requirements appropriately has always been the constraint against doing any such activity that is single-purpose only.
It appears to me that the negative prices your are using are from the Day Ahead Market where such prices are infrequent (3%) and the average (this year to date) is $4.70/MWH. In contrast, negative prices in the RTM, where most of the renewable energy is sold, occur 11% of the time and average $16.50/MWH. BTW, CAISO reports that the number of economic or voluntary curtailments for renewables is increasing. John Redding
Has anyone looked at the actual hydrograph, the runoff curve, for the years 2011 and 2017? The Sierra snowpack dominates the runoff but the timing of snow melt varies among years and may be gradually shifting to an earlier spring melt. Since the snow precipitation this year continued late into the cycle, perhaps part of the difference in timing of hydro production in those years is more from climate/weather than solar generation. About gas bubble disease, fishery biologists first thought the cause was just nitrogen gas supersaturation from high dam releases but the disease is now known to come from total air supersaturation. The actual threshold percentage saturation over 100%, how long it lasts, and the nature of the river (e.g., deep and slow moving such as on the Columbia) below a spill are other important factors affecting eventual fish mortality.
Following the data link provided by Anonymous, takes us to where we can get the data table for the 4/9/17 date shown in the article’s duck curve graph. The data table shows small hydro (providing RPS credits) is only 10% of the hydro in state. All the hydro (large and small) responded to the duck price curve and reduced mid day output 20-40% below duck head “peak need” output. Granted perhaps more flexibility is available in hydro if we are willing to let regulating reservoir elevations swing to their limits (e.g. a couple of little waves slapping over and gently washing Keswick and Natoma spillways for an hour each day.) Perhaps the state and feds can retrofit one of San Luis reservoir’s 50 MW pump-generators with soft start features so they can afford to economically start it more than once per day. I see the wind power is a natural duck cure as it peaks in the dark and was mostly resting during the sunny negative price hours at only about 10% of its duck head “peak need” output. In California’s future I see much more solar coming to pile onto the duck. With that in mind, I think it makes good policy sense to fight carbon and duck curves at the same time by allowing and even requiring solar contractors to install efficient electric heat pump water heaters when they install new PV systems. This adds controllable electric load and frees up natural gas for firing our beloved peaker plants as needed until they are obsolete.
Here’s a link to the CAISO data for the April 9 day shown in the author’s graph. http://content.caiso.com/green/renewrpt/20170409_DailyRenewablesWatch.txt
I think another commenter of course has it right, that surplus is the combination of the sum of all inflexible generation (and “inflexibly” low demand), so the question in CA of whether it is hydro of solar is something of koan — unless your perspective that one is grandfathered in and one is marginal. Certainly, when I was at Peej we thought of negative prices as being a combination of things: low demand, fast snowmelt and ample sum. Basically, a springtime phenomenon particularly pronounced after a wet year, when it is warm enough to melt snowpack quickly but no so warm as to drive demand up very much.
If you really want to tease apart the impact of hydro and solar, you could look at the actual specific hours of negative prices. Hydro flows have a diurnal pattern, but it’s pretty weak; they are almost as high at night as during the day. Demand is also low at night, so in a big hydro year you might see some negative nighttime prices. I suspect that is mitigated by some other moderately inflexible resources, such as thermal plants with a high Pmin going off for the night. Of course solar has a strong diurnal pattern, so if you are getting negative prices at solar noon and not three hours before, I think it’s fair to say that the marginal impact of the solar “caused” the negative prices.
As for must-run requirements for dams in CA — yes, many have such requirements. It’s not just because of fish, but also contractual obligations to people with water rights downriver.
Thanks for the comment. Combination indeed. But what still puzzles me is why don’t the large hydro facilities “spill” water when prices are negative. Presumably neither fish, nor agricultural users, nor any other water rights group downriver cares whether water has passed through the turbines or not.
I’m not clear on what you think the disadvantage is to running the water through the turbine if you have to ‘spill’ water anyway. I suppose there are some marginal costs to actually running the turbine (there may be marginal operational benefits?). And, as I noted in my longer response, I’m not sure whether all dams are designed to ‘spill’ water without it passing through the turbine when the water level is below the spillway. There may also be downstream dissolved O2 and N2 benefits of having the water minimally aerated – as is presumably the case for water passing through the turbine vs spilling out the top of the dam in a highly aerated plume.
I suspect, but am not certain, that complete diversion around the turbine is not a normal operation of many hydro facilities (something that can be done remotely, for example) but is a more involved operation for special circumstances. Also, the spillways for diverted water sometimes take a different path than water through the turbine, even for moderate distances, potentially inconveniencing some river users.
The machines just weren’t built when curtailment was a thing.
Riding the Google machine to the rescue, a complete list of CA hydro facilities can be found here: http://www.energy.ca.gov/almanac/renewables_data/hydro/hydro_list.xls This is CEC’s listing and as they point out on their hydro site, there are basically three types of hydro in CA – ‘pondage’ (think lakes behind dams), pumped hydro and run of river. The last category is miniscule in CA – as the spreadsheet referenced above will demonstrate. Out of a total of ~14GW listed as hydro, There are fifteen facilities identified in the CEC list – totaling 111 MW – as “run of river”. Furthermore, of that 111 MW, six of these facilities, totaling ~92 MW are in Los Angeles county and are basically energy recovery turbines on the water supplies for LA. So the remaining ~20 MW can hardly be responsible for the 4 – 5 GW of electricity production capacity shown for April 9, 2017.
There are external factors for much of the hydro in CA (those dam(n) externalities again, messing up the world as seen by economists) – including downstream water requirements, riparian rights, etc. I claim no expertise on the details of these and how extensive they are, what they mean for water flow profiles, etc., but they clearly affect water discharges from the lakes/dams portion of the hydro picture (these account for ~9.8 GW of the ~14 GW; incidentally, most of the remaining capacity is pumped storage – Castaic, Helms, Hyatt, Gianelli). There is also the question of how the dam is structured with regard to ‘spilling’ water vs moving it through a turbine(s). In some (many?) cases, the spillways are designed to handle the ‘top’ portion of the lake to prevent damage from overtopping the dam — the situation at Oroville last spring was an example of that. But below that, I’m not sure whether these same facilities have other ways of discharging water without going through the turbines. Finally, there may be other (again ‘external’) reasons for generating electricity with all of the water being discharged – contractual requirements, tax credits, etc. So the individual dam operators may never actually ‘see’ negative electricity pricing.
Thanks for this. On many of the large rivers in the Sierras, you have a large dam in the headwaters. Then you see a series of smaller volume diversion dams into aqueducts, canals or tunnels into a forebay and then into the penstock down (like one sees at Priest Grade on the way to Yosemite) to a powerhouse. These diversion dams have flow throughs as they have no powerhouse…. whatever needs to remain in the river for fish, recreation, etc., goes through or over. At the bottom of these “steps” you usually have a large storage reservoir or two; think New Melones or Pardee. These stepped powerhouses are pseudo “run-of-the-river”, although the river is highly controlled. Within reason, given smaller size forebays, one could run an entire series simultaneously, water from the upper arriving in the lower in time, etc., to get an evening peaking generation across all the powerhouses. This is largely what PGE did with its powerhouses on the Mokelumne come summer evenings… water was almost a guarantee then where water wasn’t diverted “run-of-the-river” out.
If I recall correctly, Oroville is 820 MW… but during the event, transmission was threatened or compromised, and they were not able to “spill” through the powerhouse itself – hence more volume needing to be “spilled”.
Part of the answer seems straightforward: subsidies for wind generation.
Part of the answer to the spillway question may also be straightforward: dam engineering.
Disposing of water is not free! More precisely, building a spillway is expensive, so dams are built with finite spillways. Look at discussions of dam spillway design, and it’s clear there are tradeoffs. For example:
“Many dams were built with seemingly adequate spillway capacity when they were originally constructed. In some cases, more recent data and improved hydrologic models dictate the need for increased spillway capacity. ” http://www.obermeyerhydro.com/spillway_capacity_upgrades_and_flood_management
I know little about hydrology, but when a dam overflows, it can catastrophically destroy the entire dam. Spillways provide a deliberate and safe route for excess water, but if the flow in a river is too large, the spillway itself can fail. This suggests that when a reservoir is close to full and inflow is high, safety requires running the generators in order to not overload the spillways. See for example http://cadswes2.colorado.edu/~zagona/CVEN5838/JournalArticles/dubler%20grigg%20dam%20safety%20policy%20for%20spillway%20dessign%20%20floods.pdf
The huge Oroville dam almost failed in this way a few months ago, so it is not just a hypothetical problem.
Wind subsidies were discussed extensively for Texas when it had negative prices in 2015. The TL;DR from what I read was that federal and state subsidies for wind were the main culprit:
” But wind operators have another advantage over generators that use coal or natural gas: a federal production tax credit of 2.3 cents per kilowatt-hour that applies to every kilowatt of power produced. And that means that even if wind operators give the power away or offer the system money to take it, they still receive a tax credit equal to $23 per megawatt-hour. ” (source = Slate, so this is. topic of general interest.
It appears that wind generation still receives a subsidy of about $.02 /kwh or $20/Mwh. See https://energy.gov/savings/renewable-electricity-production-tax-credit-ptc. So prices will have to go more negative than this to lead to curtailed wind generation.
Are these two factors enough to explain the negative prices? IDK. But whenever a dam’s spillways are are operating at full capacity, its operators _must_ run the generators, even when prices are negative. Perhaps that plus the wind subsidy together explain the level and extent of negative prices this year. A term paper project for an MS student?
The CEC listing of hydro facility characteristics isn’t entirely reliable. We completed a review of PG&E’s hydro facilities for the 2000 divestiture application, and 8 of 16 watersheds were completely run of river with little control over release rates. (That data is in the draft EIR prepared for the CPUC.) In the other 8 watersheds, a large number of reservoirs operated as run of river as well. But to add to that further, many of the pondage reservoirs are in fact run of river in high runoff winters, like 2017. Add to this the flood control requirements that reduce effective storage through April 1, and the pondage control shrinks further.
And speaking of flood control, during large flow events, dam operators treat powerhouses as just another flood control outlet. See for example the stories about Oroville this winter. Operators are already using the spill bypass outlets in this situation. But on the other hand, dam operators aren’t always paying attention to price–they often view a MWh as a MWh regardless of time of day. I had a conversation with the PG&E operators in which they stated their objective as maximimizing hydropower generation rather than maximizing the economic value from hydropower generation. (I won’t go into the distinction.) The first step would be to compare the negative price hours with the flood control release data (which may be available through DWR.)
This is interesting information, but one has to ask if you were asleep for this past year and just woke up thinking it is still fall 2016.
No mention of record rainfall & snowpack? No mention of Oroville? That made national & international news as it was almost lost even with primary ‘spill’ and also ‘last resort’ spill.
This is indeed interesting findings, and during the drought it was well known California lost substantial hydro peaking capacity, but why exactly hydro ‘got junk’ this year is not rocket science – and at least deserves consideration under the circumstances.
Third paragraph I say “Spring 2017 was among the rainiest in history”. Yes the snowpack is near record too. E.g. https://www.jpl.nasa.gov/news/news.php?feature=6815.
The pattern I see here is that INFLEXIBLE generation of all kinds results in negative prices. Indeed, 2011 was wet, and many hydro projects have reasons to generate rather than spill. Among these is that the owning or contracting utilities have a use for the power, but that leaves their usual suppliers of controllable generation without a market.
Another reason is that spill results in nitrogen supersaturation of tailrace waters, which some believe contributes to nitrogen gas bubble disease in juvenile salmonids; I’ll leave it to fish biologists to be more explicit about that. But BPA has regularly insisted on generating rather than spilling, to the great concern of wind project owners who in the past were booted off of transmission to make room for hydro (the wind projects lose PTC revenue when this happens, and took a successful challenge of BPA’s practice to FERC in –you guessed it — 2011).
But in the graphic in this post, I also see nuclear running right through the negative price period. This is the ultimate inflexible generator. I often treat nuclear, wind, and solar alike: all three produce about half of their output at less-desirable hours. In the case of nuclear it is predictably available when you don’t want it, while wind and solar are unpredictably available when you do want it. BUT, the graphic above shows nuclear running continuously through the negative pricing period. While BPA occasionally asks for reduced generation from the Columbia Generating Station, it’s not clear that Palo Verde or Diablo Canyon have been curtailed. In order to be available during the high-load-hours when prices are positive, the nuclear units must run mid-day (when solar is flush) and overnight (when wind may be significant) and the negative prices pop up.
Finally, of course, wind will likely continue to run until the negative prices bump up against the production tax credit. Even at -$15/MWh, a wind project is probably still generating positive cash flow for it’s owner. The current PTC is $.023/kWh for projects that entered service before January 1, 2017, and $.0184/kWh for those entering service this year. https://energy.gov/savings/renewable-electricity-production-tax-credit-ptc This credit steps down annually for new systems, and is scheduled to end for new projects in 2020; however, projects receive the credit for 10 years from the date of commercial operation.
Bottom line: inflexible generation of all kinds contributes to negative prices. Flexible load is the best way to address this: grid-integrated electric water heating, ice-storage air conditioning, smart charging of electric vehicles, and other load that can be scheduled is the cheapest form of “storage” to address this market anomaly. Declining prices for battery storage are approaching the point where they are also competivie.
Interesting.
But if California can’t spill excess water why not curtail solar production?
My colleague Catherine Wolfram raised several potential explanations in her March blog post entitled “Is the Duck Sinking?“: production tax credits, the renewable portfolio standard, and operating constraints. In California small hydro counts under the renewable portfolio standard, so this could be part of the explanation for hydro too. Under a simple power purchase agreement, a small hydro facility might be paid a pre-specified price per MWh irrespective of market price, leaving the hydro facility with no incentive to shut down when prices are negative. What an economist would ask though, is why not structure a richer contract that aligns operational incentives with wholesale prices?
http://www.caiso.com/market/Pages/ReportsBulletins/DailyRenewablesWatch.aspx#curtailment